Aptos price has been consolidating in a descending channel for the past few weeks, and it now appears to be preparing for a breakout. This movement suggests that the cryptocurrency could be gearing up for a decisive shift.
If the bulls take charge and push through resistance, Aptos price could rise toward $6.20, with the potential to reach $8.40 or even $11, depending on the momentum. As of now, APT is trading at $4.35, down by 4.39% over the past day.
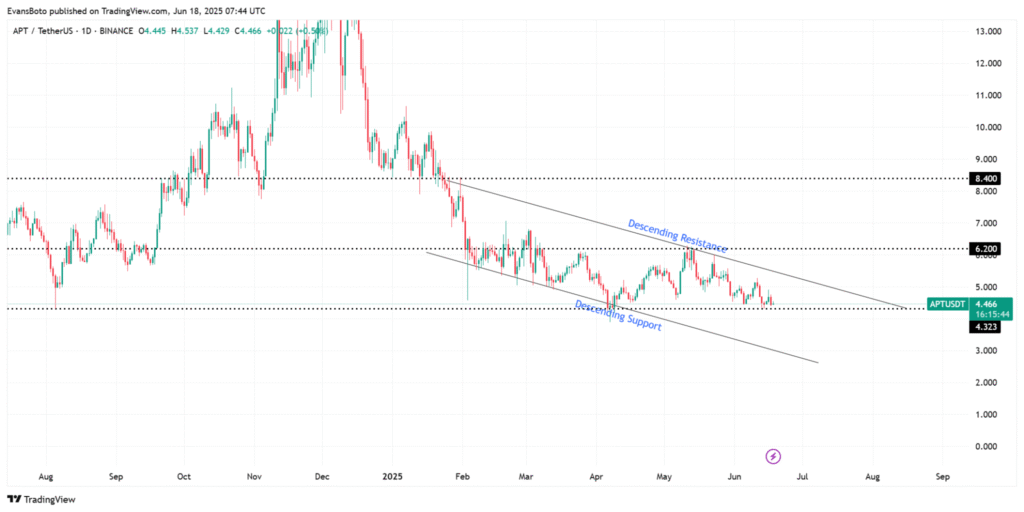
Key Developments in Aptos Price Action
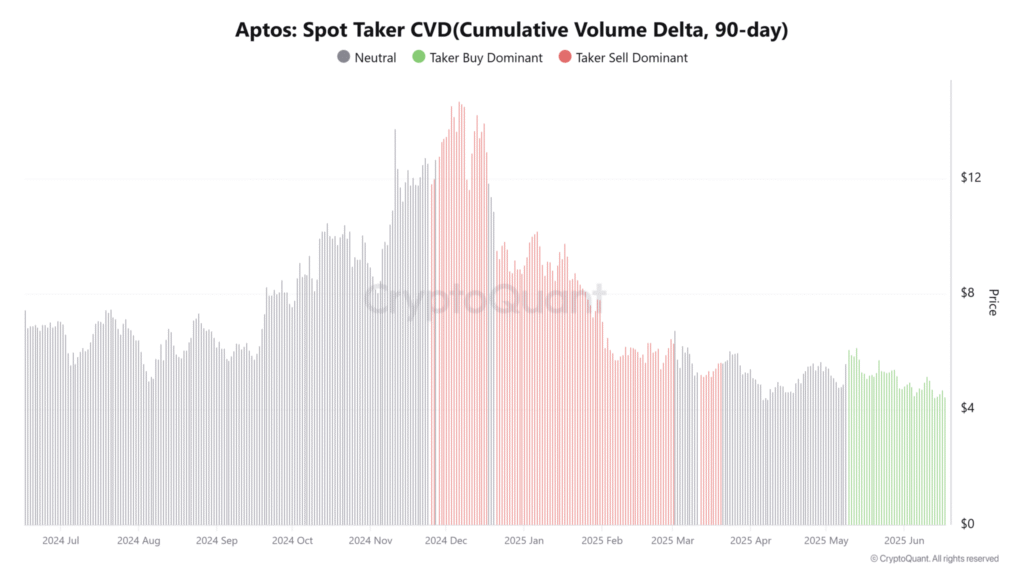
Several developments are signaling that the Aptos price could soon break out of its current pattern. A key indicator is the Spot Taker Cumulative Volume Delta (CVD) over the past 90 days, which shows that buyers are aggressively lifting offers at market price.
This surge in buying activity suggests a growing demand for Aptos, often seen before a price breakout. As more buyers enter the market, it increases the likelihood of Aptos breaking through key resistance levels and continuing its upward movement.
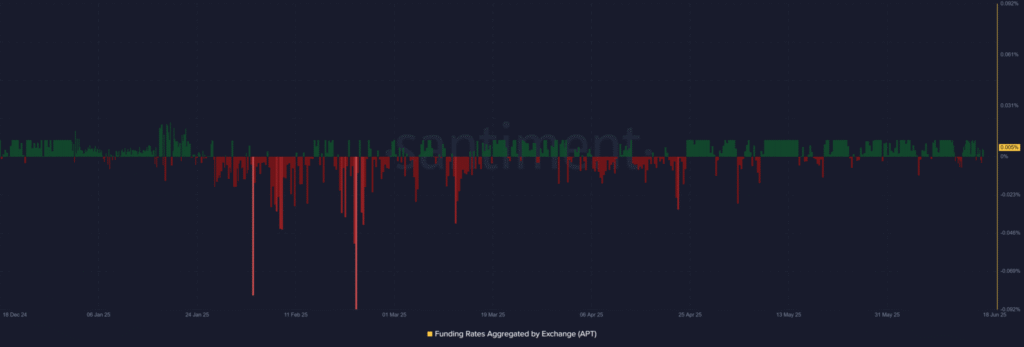
Moreover, Aptos Funding Rates have shifted from negative to positive territory, now standing at +0.0053%. This shift indicates a change in trader sentiment, with long-positioned traders becoming more confident and willing to pay higher fees to maintain their leverage.
When Funding Rates flip positive and are combined with strong buying pressure, it often signals an impending price surge. This change further supports the possibility of a breakout for Aptos price.
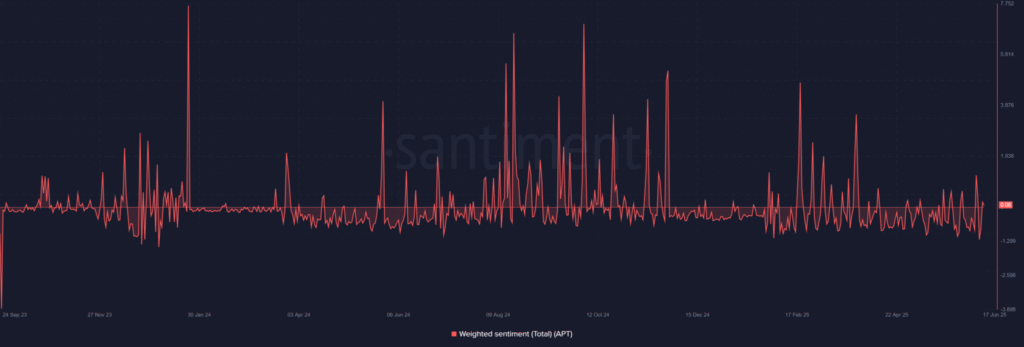
Sentiment Shifting Toward Bullish
Another positive development for Aptos price is the shift in sentiment. For weeks, the market sentiment had remained negative, signaling a bearish outlook for the asset. However, the sentiment has now flipped positive, reaching +0.08. While the change is modest, it’s an important shift, as historical data shows that when sentiment turns positive during a period of consolidation, it often precedes a price rally.
Liquidation Clusters and Potential Short Squeeze
Aptos price could experience a sharp increase if it breaks above $4.60, triggering a wave of short squeezes. Binance’s 24-hour Liquidation Heatmap reveals that there is a significant concentration of short liquidations between the $4.55 and $4.80 range.
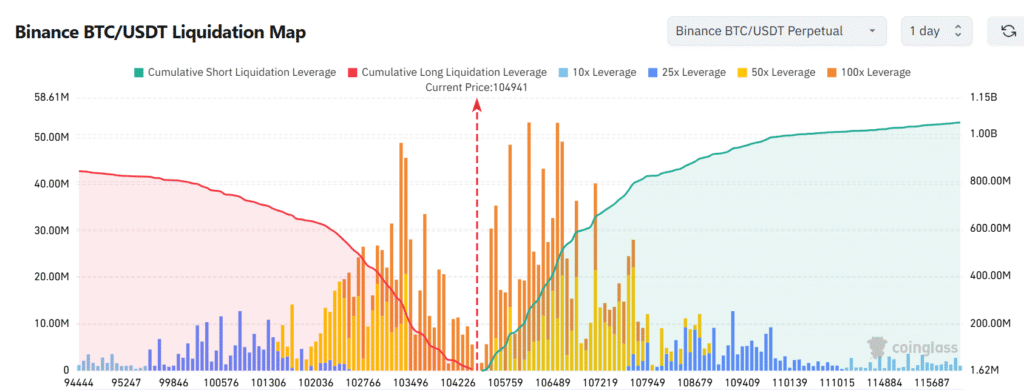
If Aptos price moves above this level, short sellers may be forced to buy back their positions, accelerating the upward momentum. This buying pressure could fuel a rapid price increase, confirming the breakout scenario. Furthermore, the heatmap indicates a lack of significant sell-side friction near the current price, suggesting that the path to higher targets may be relatively clear.
Technical Indicators Support Bullish Outlook
Several technical indicators are aligning to support the possibility of a breakout for the Aptos price. The combination of rising Taker Buy Dominance, positive sentiment, and the shift to positive Funding Rates creates a strong foundation for a potential price surge.
| Month | Minimum Price | Average Price | Maximum Price | Potential ROI |
|---|---|---|---|---|
| June | $3.23 | $3.93 | $4.62 | 0.87% |
| July | $3.59 | $3.75 | $3.90 | -14.8% |
| August | $4 | $4.77 | $5.54 | 21% |
| September | $5.42 | $5.64 | $5.86 | 27.9% |
| October | $3.51 | $4.77 | $6.02 | 31.4% |
| November | $3.65 | $4.76 | $5.86 | 27.9% |
| December | $4.34 | $5.70 | $7.05 | 53.9% |
If Aptos continues to maintain upward momentum and volume increases, the price could successfully break out of its descending channel and move toward higher resistance levels.
Aptos Price Targets and Outlook
If Aptos breaks through the $4.60 resistance level, the next targets could be $6.20, $8.40, and even $11, depending on market conditions. For this breakout to be sustained, buying pressure and volume will be crucial.
If traders continue to support the bullish move, the price could push toward these targets. While challenges may arise, the current signals suggest that Aptos is well-positioned for an upward surge.
Conclusion
Aptos price is showing strong signs that it could soon break out of its current consolidation pattern. Key indicators, including rising Taker Buy Dominance, positive sentiment, and a shift in Funding Rates, point toward increased buying pressure. The presence of short liquidation clusters between $4.55 and $4.80 further suggests that if Aptos breaches $4.60, the price could surge rapidly.
However, for this breakout to be sustained, it will need to be supported by volume and continued buyer participation. With all indicators pointing in the same direction, Aptos price may be on the verge of a significant rally.
Frequently Asked Questions (FAQ)
1. What price targets could Aptos reach?
If the breakout occurs, Aptos could potentially target $6.20, $8.40, and even $11, depending on volume and market conditions.
2. What indicators suggest a breakout for Aptos price?
The key indicators include Taker Buy Dominance, positive Funding Rates, and a shift in sentiment. These all point toward a possible breakout.
3. How does the liquidation heatmap impact Aptos price?
The Liquidation Heatmap suggests that a breach above $4.6 could trigger a wave of short squeezes, which would accelerate the price movement upward.
4. Why is the sentiment shift important for Aptos?
A shift from negative to positive sentiment often leads to improved returns and is a common signal for bullish breakouts, supporting the case for a potential Aptos rally.
Appendix: Glossary of Key Terms
Aptos (APT): A layer-1 blockchain designed for scalability and high-speed transactions, supporting decentralized applications.
Taker Buy Dominance: A metric that shows the buying pressure in the market, where aggressive buyers are lifting offers at market prices.
Cumulative Volume Delta (CVD): A technical indicator used to measure the buying and selling pressure by comparing the volume of buys and sells over a period.
Funding Rates: The cost traders pay to hold leveraged positions in the futures market, indicating market sentiment.
Short Squeeze: A situation where short sellers are forced to buy back their positions due to a rapid price increase, which further drives the price up.
Liquidation Heatmap: A visual representation showing the concentration of liquidations in the market, identifying potential levels where significant price movement could occur.
Weighted Sentiment: A metric that aggregates social media and market sentiment, reflecting the general mood towards an asset.
Resistance Level: A price point at which an asset faces selling pressure, preventing the price from rising further.
Reference
AMB Crypto – ambcrypto.com


