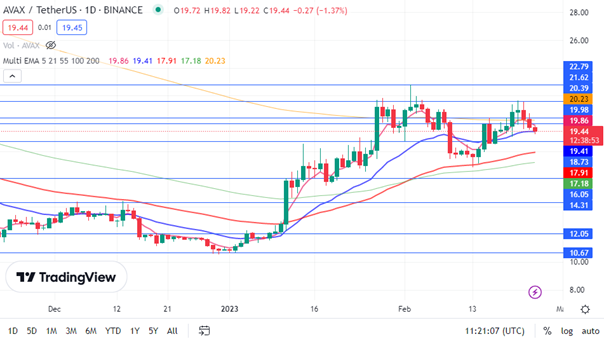
Understanding the intricacies of trading AVAX can be challenging, but leveraging technical indicators like the EMA21 might provide the advantage you need. By examining the historical performance of AVAX in relation to the Exponential Moving Average (EMA21), traders can uncover patterns that hint at future movements. This blog will explore practical strategies for using EMA21 to support your trading decisions, ensuring you are well-equipped to navigate the fluctuations of the AVAX market effectively.
Historical Performance of AVAX in Relation to EMA21

Examining the historical performance of AVAX in relation to the EMA21 (Exponential Moving Average) can offer insightful perspectives for traders. EMA21, known for its responsiveness to recent price movements, simplifies trend identification.
Historically, AVAX has exhibited notable reactions to the EMA21, including:
- Support Levels: AVAX often finds support at the EMA21 during bull runs. When prices dip to the EMA21 but bounce back, it confirms the strong upward momentum.
- Resistance Points: Conversely, during bearish trends, the EMA21 sometimes acts as a resistance level. Prices approaching but failing to break above the EMA21 often signal that the downward trend is still in place.
- Trend Confirmation: When AVAX crosses the EMA21, traders frequently interpret it as a trend change. For instance, an upward crossover suggests a potential bullish phase, while a downward crossover indicates possible bearishness.
Comparative Table: AVAX Price Reaction to EMA21
| Date | AVAX Price | Interaction with EMA21 | Outcome |
|---|---|---|---|
| 2021-05-15 | $30.00 | Touched EMA21 | Bounced back up |
| 2021-07-10 | $12.00 | Fell below EMA21 | Continued downtrend |
| 2021-09-01 | $45.00 | Crossed above EMA21 | Entered bull phase |
Understanding these patterns assists in comprehending how AVAX’s price interacts with the EMA21, helping traders make more informed decisions based on historical data.
Practical Strategies for Using EMA21 to Support Trading Decisions

When it comes to trading AVAX, the 21-day Exponential Moving Average (EMA21) can be an invaluable tool. Here are some practical strategies for integrating EMA21 into your trading decisions:
Trend Identification
- Use EMA21 to determine the overall trend direction.
- When prices stay above EMA21, AVAX is typically in an uptrend.
- Conversely, if prices are below EMA21, the trend is likely downward.
Entry and Exit Signals
- Enter long positions when AVAX price crosses above the EMA21.
- Consider exiting positions when the price falls below EMA21, signaling a potential trend reversal.
Support and Resistance Levels
- Recognize EMA21 as a dynamic support level in uptrends.
- In downtrends, EMA21 serves as a resistance level, helping you decide when to short AVAX.
Confirmation with Other Indicators
- Combine EMA21 with other technical indicators like the Relative Strength Index (RSI) to enhance decision-making.
- For instance, a bullish crossover above EMA21 coupled with an RSI above 50 strengthens the buy signal.
| Indicator | Action | Confirmation |
|---|---|---|
| Price > EMA21 | Consider Buying | RSI > 50 |
| Price < EMA21 | Consider Selling | RSI < 50 |
Applying these strategies helps traders make informed decisions, leveraging EMA21 to maximize AVAX trades effectively.
Frequently Asked Questions
What is EMA21, and why is it significant in technical analysis?
The EMA21 stands for the 21-day Exponential Moving Average, a type of moving average that gives more weight to recent prices to make it more responsive to new information. In technical analysis, the EMA21 is often used because it can act as a dynamic support or resistance level, helping traders identify potential entry and exit points in the market. When a price is above the EMA21, it is generally considered a bullish signal, and when it is below, it may indicate a bearish trend.
How can the EMA21 provide support for AVAX?
The EMA21 can provide support by serving as a crucial price level where buying interest may increase, thereby potentially halting or reversing a declining trend. When the price of AVAX touches or approaches the EMA21, traders often look for buying opportunities as the EMA21 can act as a floor. It’s especially useful in trending markets, where it can continuously provide areas of support as the price undergoes corrections but remains within an overall uptrend.
What other indicators are useful alongside EMA21 for AVAX technical analysis?
While the EMA21 is a valuable tool, it is often used in combination with other indicators to confirm trends and make more informed trading decisions. Common complementary indicators include the Relative Strength Index (RSI), which measures the magnitude of recent price changes to evaluate overbought or oversold conditions, and the Moving Average Convergence Divergence (MACD), which helps in identifying changes in the strength, direction, momentum, and duration of a trend. Using these alongside the EMA21 can provide a fuller picture of the market’s movements.
Can the EMA21 fail to provide support, and how should traders respond?
Like any technical analysis tool, the EMA21 is not foolproof and may fail to provide support if market conditions change suddenly. For instance, in cases of high volatility, news events, or market sentiment shifts, the price may break through the EMA21 level, indicating that the support has failed. When this happens, traders should watch for other support levels or pivot points and re-evaluate their trading strategies. Employing stop-loss orders to limit losses and maintaining flexibility in trading plans are crucial for managing such situations effectively.


