Bitcoin price traded above $123,000 for the first time, sparking speculation of a potential local top. However, the sharp 6% retracement to $115,700 has raised red flags. The latest Bitcoin price prediction models indicate a pause or potential correction before any sustained upward momentum resumes.
Bitcoin Price Prediction: Pullback Remains Historically Low
Bitcoin’s advanced NVT signal crossed above historic red deviation bands, often associated with market cycle peaks. This suggests overvaluation and potential exhaustion in the ongoing trend. Still, Bitcoin’s deepest pullback in the current bull run stands at only 23.48%, far below historic cycle corrections.
This limited drawdown hints at underlying strength in the trend, despite flashing short-term overextension warnings. Analysts note that previous corrections ranged between 30% and 80%. Therefore, this restrained correction may reflect maturing market dynamics and growing institutional involvement.
Moreover, volume indicators show significant cluster formations between $117,000 and $118,000. These clusters represent zones where large investors previously entered or exited positions. That creates layered support and resistance levels, influencing Bitcoin price prediction scenarios.
Technical Patterns Suggest Imminent Volatility
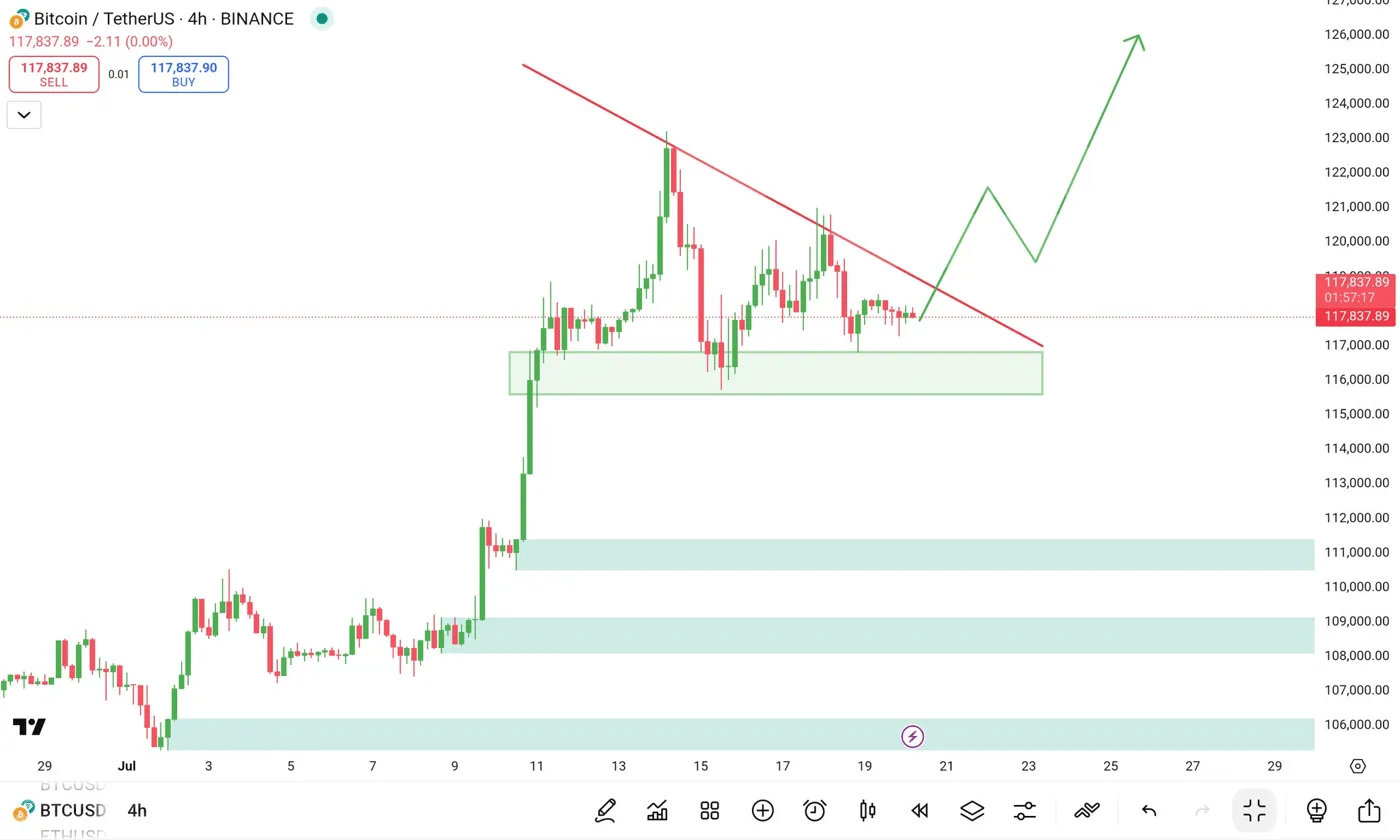
BTC is currently consolidating within a symmetrical triangle, signaling an upcoming breakout. The 4-hour chart shows compression between ascending support at $116,000 and descending resistance near $120,000. This tightening range often precedes heightened volatility.

The apex of this pattern aligns near $117,837, setting a pivotal moment for future movement. A break above resistance could lead to a surge toward $125,000. Conversely, losing support may trigger a drop toward $111,000.
This symmetrical formation indicates that neither bulls nor bears hold precise control. Market participants await a decisive move to validate either continuation or correction. As price coil, traders closely monitor for breakout confirmation to assess the next Bitcoin price prediction level.

Furthermore, historical statistics indicate that symmetrical triangles tend to be solved with steep directional moves. This makes risk management a factor of significance to short-term traders as well as long-term investors. Therefore, failed tests of important technical areas may become a trigger for powerful follow-through.
Macro Indicators Point to Maturing Cycle
Merlijn The Trader stated Bitcoin has entered the “Distribution” phase, citing correlations with the global M2 money supply. He explained, “Liquidity is still expanding, but gains will now become more volatile and measured.” This shift adds a new layer to ongoing Bitcoin price prediction frameworks.
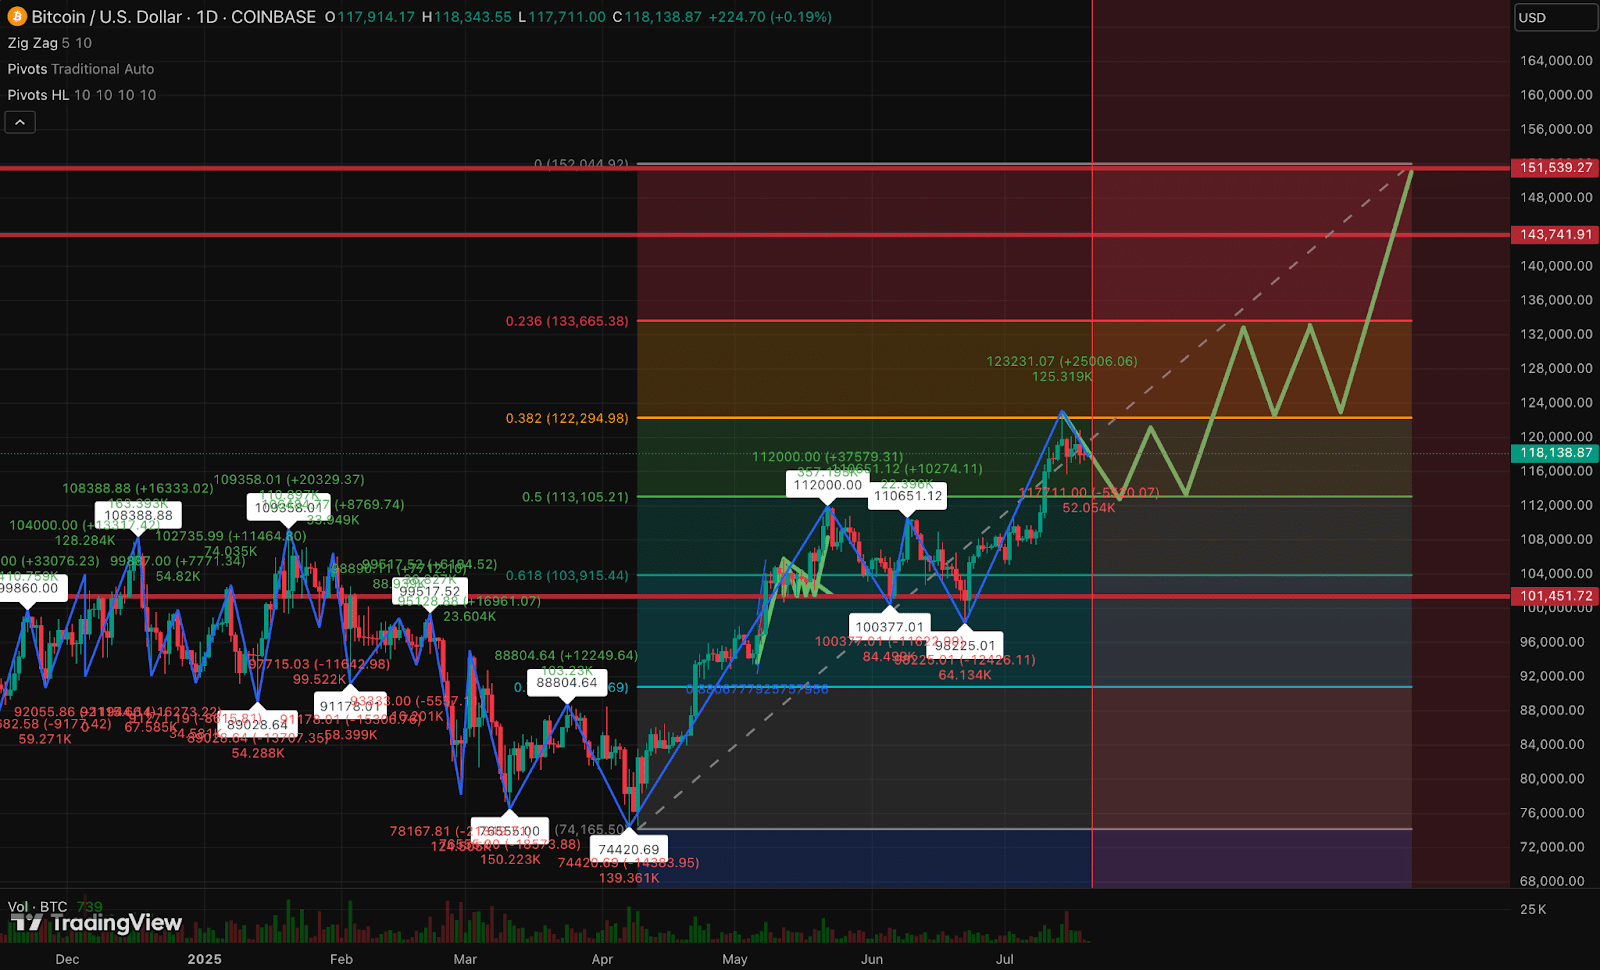
Furthermore, complex Fibonacci projections indicate a potential cycle peak in October. These models suggest that the path to higher targets will involve consolidation rather than an immediate parabolic move. Resistance zones at $133,665 to $151,539 remain longer-term goals.
Cluster volume levels at $117,000 and $118,000 are also the points of focus of accumulation and distribution. In the past, institutional investors have shown a preference for these levels. This behaviour reinforces their importance in defining short-term price action and shaping broader Bitcoin price prediction sentiment.
According to CoinMarketCap, the current Bitcoin price of $119,391 reflects a 1.1% intraday gain. Nevertheless, traders are not in complete confidence as both on-chain and technical indicators send mixed messages. This maturation cycle will be led by patience and confirmation of strategic positioning.
Summary
Bitcoin recently peaked at $123,100 before retracing to $115,700, signalling a possible local top. On-chain indicators are displaying indications of overextension, with technical indicators showing the impacted volatility. The price action is stagnating within a range of $116,000 and $120,000, and possible breakouts should aim at either $125,000 or $111,000.
The macro data realigns the bull cycle to be in a mature state; this is in concurrence with a probable peak in October. Overall, Bitcoin price prediction scenarios emphasise caution and close monitoring of breakout levels.
FAQs
What caused the recent Bitcoin retracement from $123,100?
Bitcoin retraced due to overextension signals from on-chain metrics like NVT crossing historical deviation bands.
What is the significance of the symmetrical triangle pattern?
The pattern suggests price compression and potential for a strong breakout, either upward or downward.
What are the current support and resistance levels?
Support lies between $116,000 and $117,000, while resistance is near $120,000 on the 4-hour chart.
What is the longer-term Bitcoin price prediction?
Analysts project a cycle peak between $133,665 and $151,539 by October, based on Fibonacci analysis.
How do volume clusters affect Bitcoin price prediction?
They indicate zones of high institutional activity, creating strong support and resistance zones during consolidation.
Glossary of Key Terms
NVT Signal – Network Value to Transactions ratio; used to identify potential overvaluation or undervaluation in Bitcoin.
Symmetrical Triangle – A chart pattern indicating price consolidation and upcoming breakout potential.
Volume Clusters – Price ranges with high trading activity, often showing where large investors accumulate or distribute assets.
Fibonacci Analysis – A method using Fibonacci ratios to forecast potential market turning points or targets.
Distribution Phase – A market phase where gains slow, and large holders begin selling or distributing their assets.


