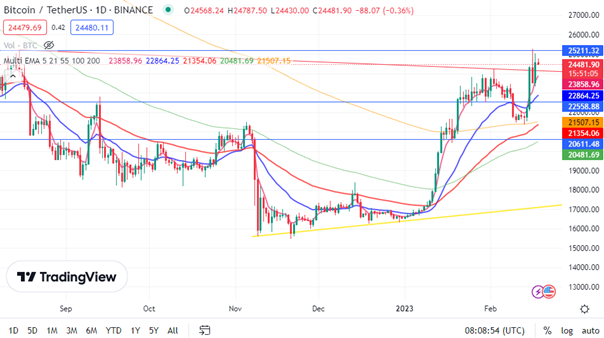
Bitcoin’s volatility keeps investors and enthusiasts on their toes, making it essential to understand its price movements. By analyzing key technical indicators, one can better anticipate market shifts and make informed decisions. In this post, we will explore technical analysis to decode bitcoin’s recent behavior, discuss critical indicators that can signal future trends, and predict potential scenarios for the cryptocurrency.
Understanding Bitcoin’s Price Movements

Bitcoin’s price movements can seem unpredictable, but several factors influence its volatility. Understanding these elements can provide valuable insights:
Market Demand
- Supply and demand: The limited supply of 21 million bitcoins creates scarcity, impacting value.
- Market sentiment: News events and investor perceptions can drive price swings.
Regulatory News
- Government regulations: Announcements of new regulations or bans can sharply affect bitcoin prices.
- Legal status: Countries adopting or rejecting bitcoin as legal tender influence market moves.
Technological Developments
- Blockchain advancements: Upgrades and enhancements in Bitcoin’s technology can cause price appreciation.
- Adoption of technology: Increased use in industries boosts confidence and value.
Investor Behavior
- Psychological factors: Fear and greed often dictate rapid market changes.
- Investment patterns: Large purchases or sales, often by institutional investors, impact price trends.
In conclusion, understanding these factors can help anticipate bitcoin’s price movements. Thus, staying informed about market demand, regulatory news, technological developments, and investor behavior is crucial for investors.
Technical Indicators to Watch

When analyzing bitcoin’s market behavior, several technical indicators are crucial for making informed predictions. Here are some key metrics to keep an eye on:
Moving Averages (MA)
- Simple Moving Average (SMA): This average is calculated over a specific time period and helps identify the overall price trend.
- Exponential Moving Average (EMA): Unlike SMA, EMA gives more weight to recent prices, making it more responsive to new information.
Relative Strength Index (RSI)
- RSI measures the speed and change of price movements.
- An RSI above 70 typically indicates that bitcoin might be overbought, while an RSI below 30 suggests it could be oversold.
Moving Average Convergence Divergence (MACD)
- MACD shows the relationship between two EMAs.
- A positive MACD suggests upward momentum, while a negative MACD points to potential declines.
Bollinger Bands
- Bands: These are plotted two standard deviations away from a simple moving average.
- Bollinger Bands are useful for identifying periods of high volatility.
Candlestick Patterns
- Candlestick charts offer a visual representation of price movements.
- Common patterns include the "hammer," "doji," and "engulfing" patterns.
Understanding these technical indicators can help traders better navigate bitcoin’s often turbulent waters. Therefore, keeping an eye on these metrics is essential for anyone seriously considering bitcoin investments.
Future Predictions and Potential Scenarios
Bitcoin’s future remains a topic of intense debate among investors and analysts. While predicting the exact future of bitcoin can be challenging, several potential scenarios provide insights into possible trends.
Bullish Scenario:
- Mass Adoption: If more global institutions and governments adopt bitcoin, its price could surge.
- Continued Inflation Hedging: With ongoing global economic uncertainties, investors might continue to turn to bitcoin as a hedge against inflation.
Bearish Scenario:
- Regulatory Crackdowns: Increased regulation could stifle bitcoin’s growth, potentially leading to a price drop.
- Technological Failures: Security breaches or technological vulnerabilities might undermine confidence in bitcoin.
Neutral Scenario:
- Market Maturity: Bitcoin’s price could stabilize as the market matures, leading to reduced volatility.
- Balanced Regulation: Moderate regulation may bring legitimacy to bitcoin without significantly hampering its growth.
Predictions Table
| Scenario | Potential Outcome |
|---|---|
| Mass Adoption | Price surge |
| Inflation Hedging | Increased investor confidence |
| Regulatory Crackdowns | Price drop |
| Technological Failures | Undermined market confidence |
| Market Maturity | Stabilized price, reduced volatility |
| Balanced Regulation | Legitimacy with steady growth |
In conclusion, bitcoin’s trajectory will depend on various factors including regulatory developments, technological advancements, and macroeconomic conditions. Thus, staying informed is essential for anyone involved in this dynamic market.
Frequently Asked Questions
What is Bitcoin technical analysis?
Bitcoin technical analysis involves studying past market data, primarily price and volume, to forecast future price movements of Bitcoin. This method relies heavily on charts and other tools to identify patterns that can suggest future trends. Traders and investors often use technical analysis to make informed decisions about buying or selling Bitcoin.
How does technical analysis differ from fundamental analysis?
While technical analysis focuses on historical price and volume data to predict future trends, fundamental analysis assesses the intrinsic value of an asset by considering a range of factors including economic indicators, industry conditions, and company financials. For Bitcoin, fundamental analysis might look at metrics like network activity, adoption rates, and regulatory news.
Why do some experts say "the war is not over" in Bitcoin technical analysis?
The phrase "the war is not over" suggests that there is ongoing uncertainty and volatility in the Bitcoin market. Despite periods of stability or growth, Bitcoin is still subject to significant market fluctuations, influenced by factors such as regulatory changes, market sentiment, and macroeconomic events. Hence, analysts and traders need to remain vigilant and continue to monitor technical indicators.
What tools are commonly used in Bitcoin technical analysis?
Common tools used in Bitcoin technical analysis include:
- Candlestick Charts: Show opening, closing, high, and low prices within a particular time frame.
- Moving Averages: Help smooth out price data to identify trends over specific periods.
- Relative Strength Index (RSI): Measures the speed and change of price movements to identify overbought or oversold conditions.
- Bollinger Bands: Depict volatility by creating bands around a moving average.
- MACD (Moving Average Convergence Divergence): A trend-following indicator that shows the relationship between two moving averages.
These tools, among others, help analysts and traders make predictions about future price movements.


