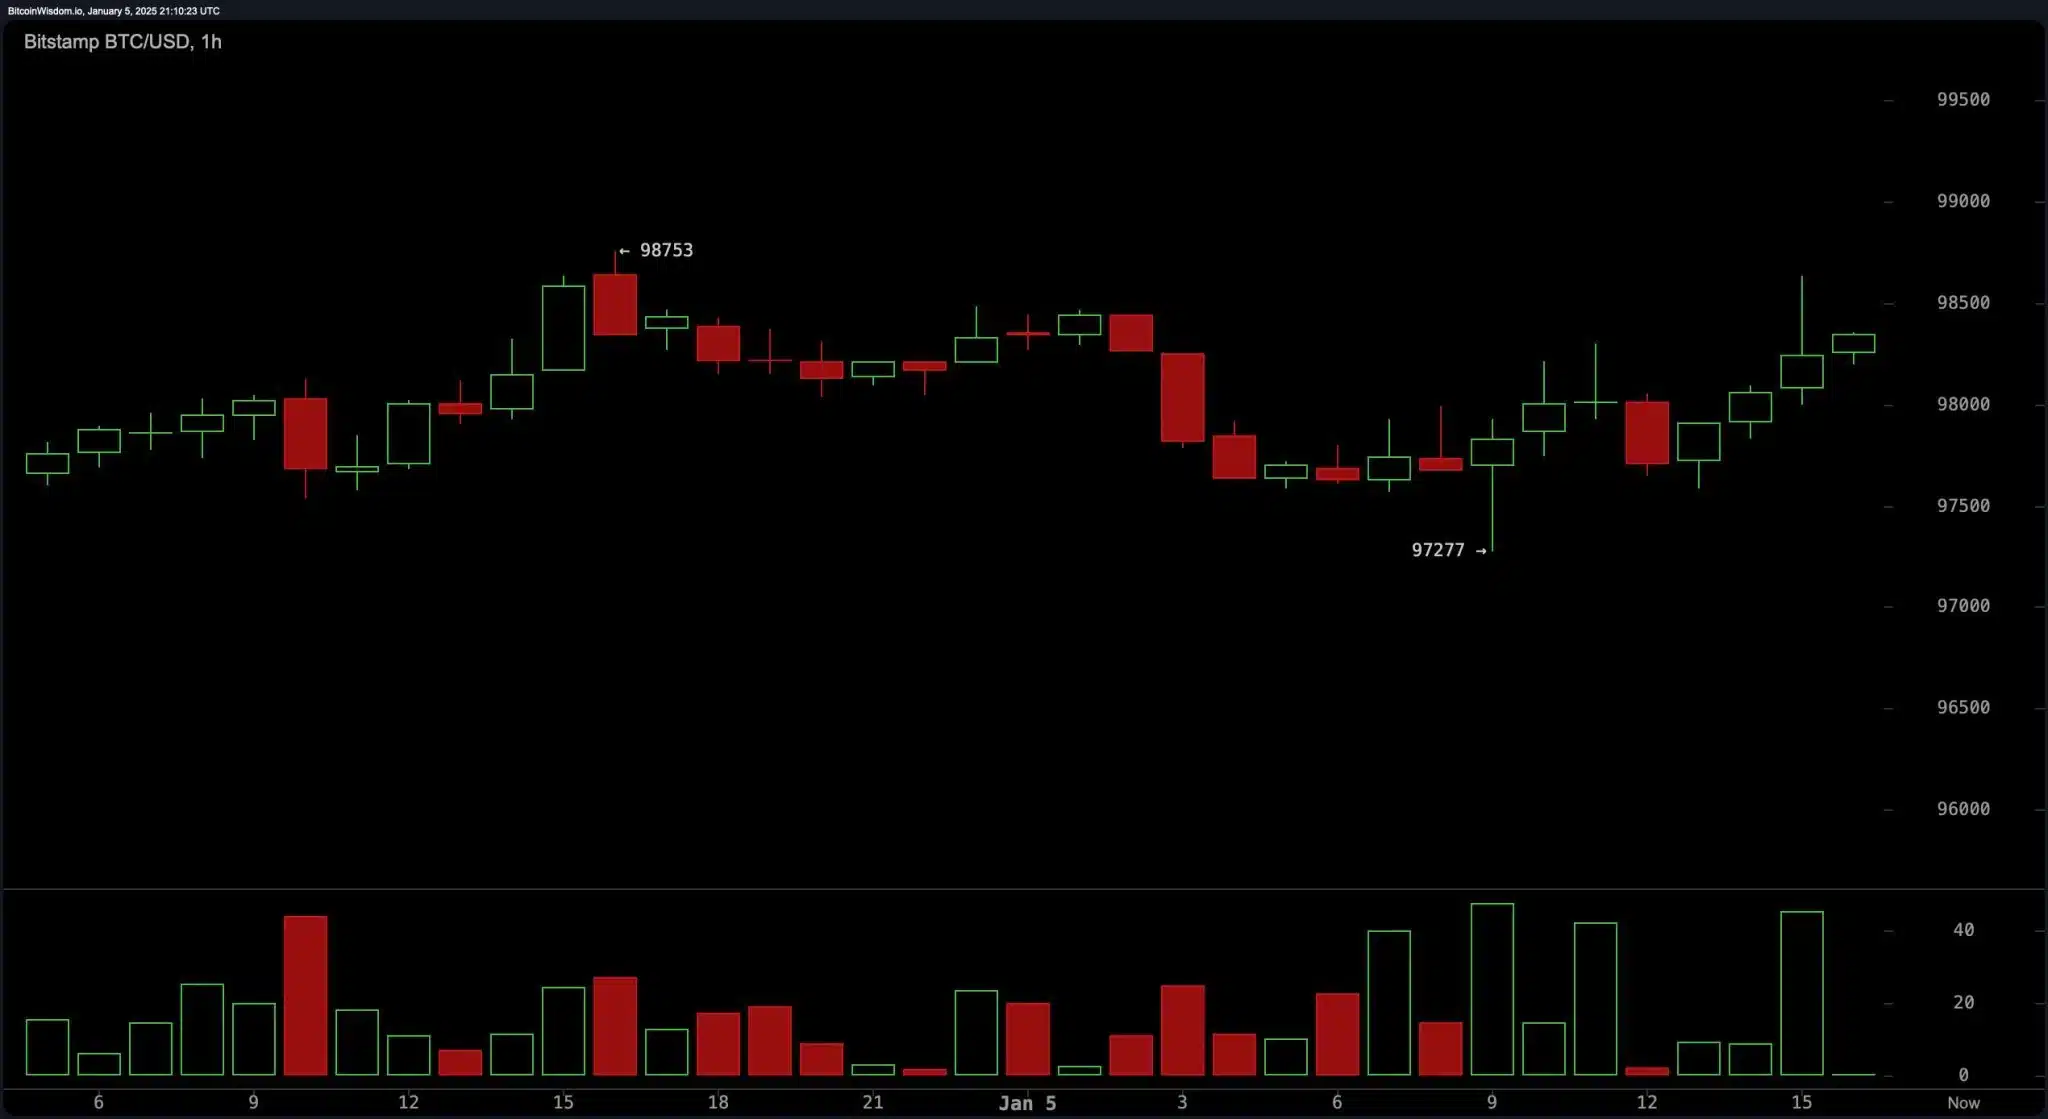
Based on our last Bitcoin 1-hour chart analysis, Bitcoin has rebounded in $97,277 and is testing the $98,000 level as support. Bullish candlesticks warn of upside momentum. However, subdued volume pushes those expectations back into a box.
Now, traders are closely watching if BTC breaks through this resistance to push it further past or retracts to settle close to $97,000. The first trend looks good, but there is a hint of hesitation around key price levels.
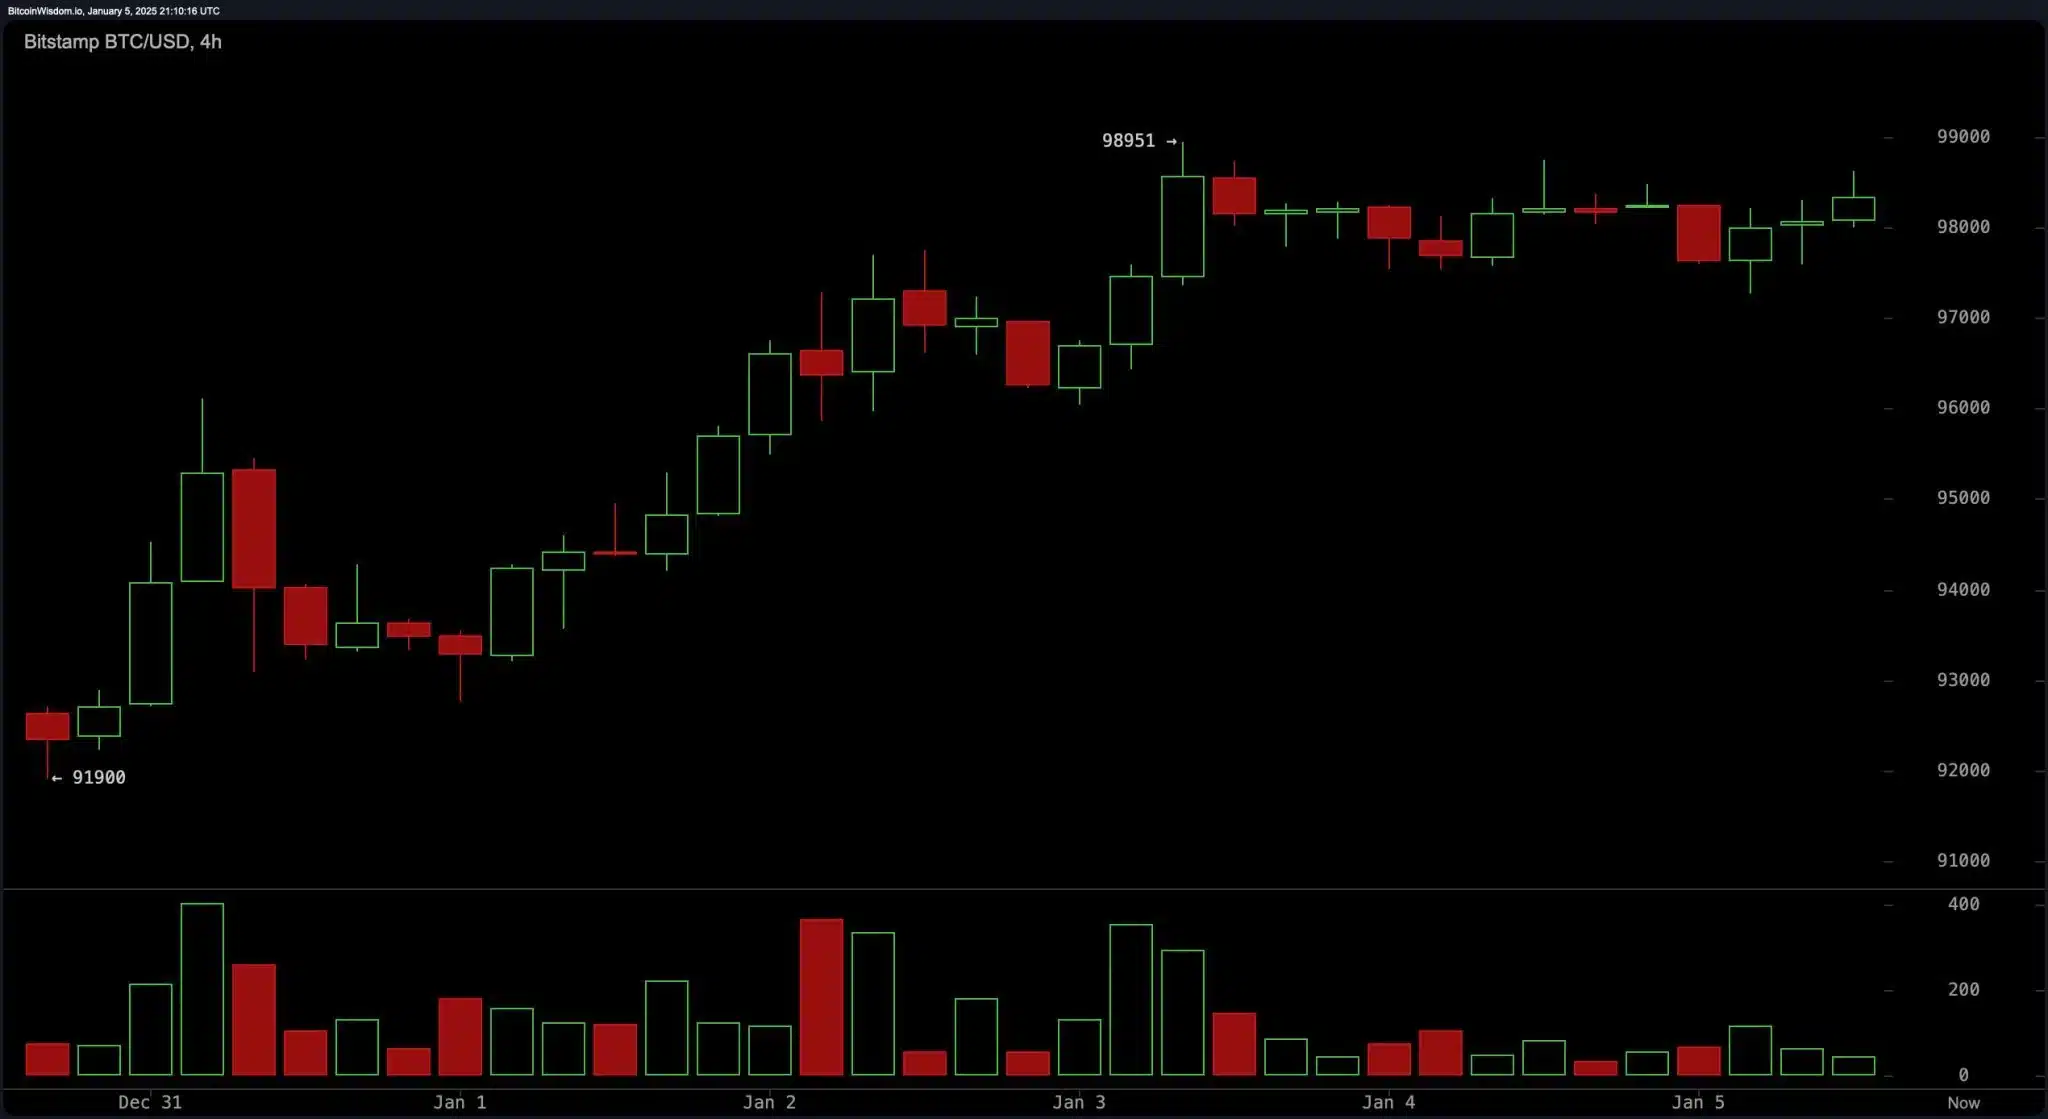
Bitcoin continues to establish higher lows, suggesting a relatively short-term bullish sentiment on the 4-hour chart. Yet, the $98,951 resistance continues to soar high as attempts to pass it failed earlier. Outlook becomes complex when coupled with the variability in trading volume.

Key Resistance Levels: Will Bitcoin Surpass $98,951?
Prices might eventually peak above $100,000 level if successful break above $98,951 is achieved. On the other hand, if this level isn’t cleared, the pullback towards $96,000–$95,000 could be a prospect.
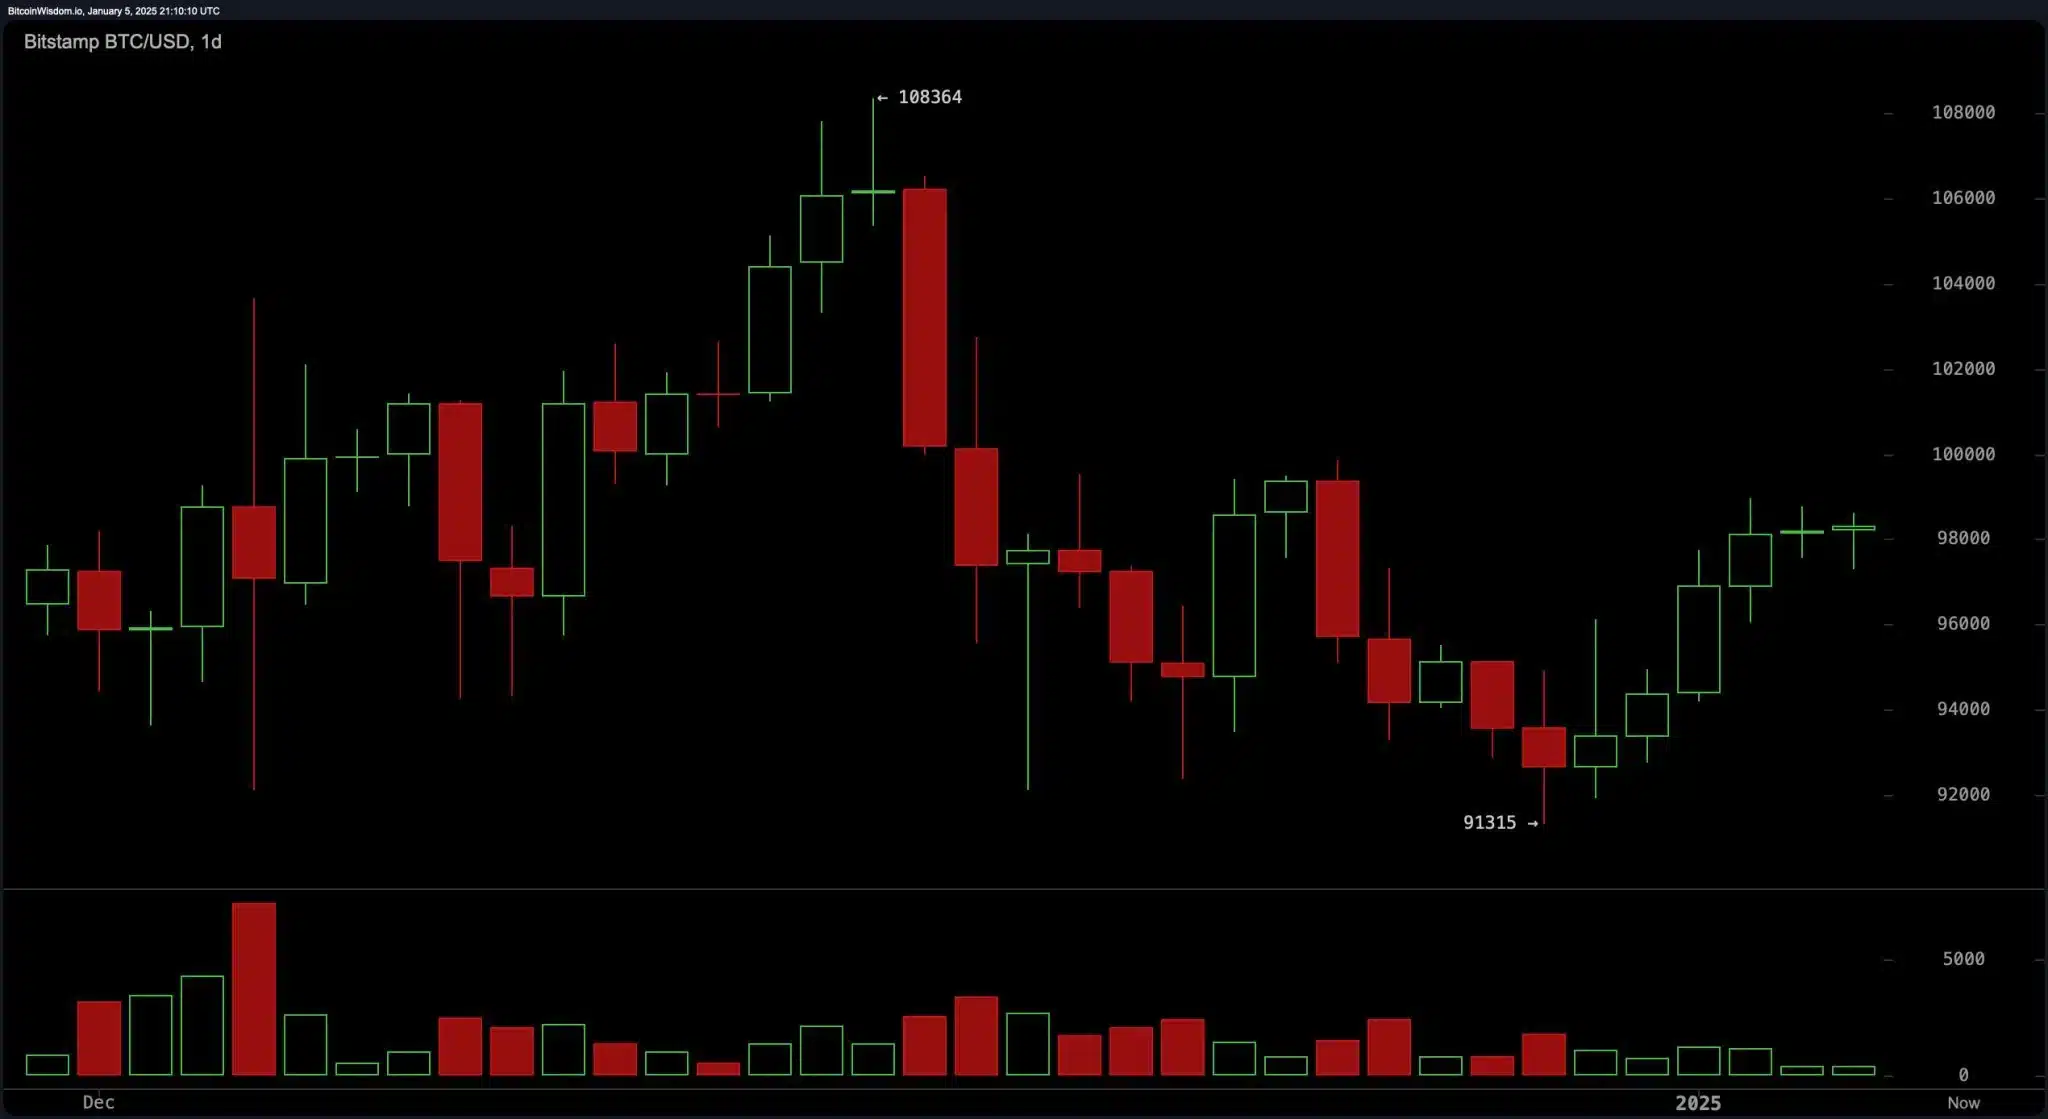
On daily frames of reference, Bitcoin is seen to be recovering from a recent low of $91,315. On the broader trend, the effort is to break through the $98,000–$100,000 resistance corridor. If trading volumes expand, a breakout and upward momentum may happen, though activity is sluggish now and could lead to consolidation. Prices could push back to the $95,000 $92,000 range, but that could take time.

Technicals for BTC remain neutral. We see the relative strength index (RSI) at 55 which means neither that the conditions are overbought nor oversold. Additionally, the Stochastic oscillator shows 81 and the commodity channel index (CCI) at 34, indicating a mild bullish pressure.
The average directional index (ADX) at 20 does indicate the lack of a strong trend, but the momentum oscillator and the moving average convergence divergence (MADC) suggest that a move is more likely to be seen.
Moving Averages Signal Support and Resistance for Bitcoin

Other support for a bullish case comes in the form of moving averages. Immediate support levels are the 10-period EMA at $96,688 and SMA at $95,485. Short-term resistance is also represented by the 30-period SMA now at $98,229, which is close to the 30-period SMA.
Bitcoin’s current consolidation within a narrow range, while highlighting this setup, points towards when and how the market will move next following this consolidation. As of 5 p.m. Eastern Time on Sunday, BTC was trading at $98,398.

Bitcoin remains on a short term bullish trend because of steady higher lows and a breakout above $98,951 support level. BTC is in line to cross psychologically significant $100,000 mark and that could be achieved via a surge in trading volume.
But questions remain about lacklustre trading activity. A pullback to the $96,000–$95,000 zone looks likely if $98,951 resistance holds, with support near $92,000 in a bearish scenario. Uncertainty over how the path ahead will play out keeps market participants cautious.
Conclusion
To overcome Bitcoin’s path forward, it will need to break past the $98,951 resistance, with $100,000 as a possibility if volume increases. But the trading is subdued, questioning its sustainability. If resistance fails to hold, then a pullback to $96,000–$95,000 is still possible. Traders wait on BTC’s next decisive move amid optimism and caution.
Stay tuned to The BIT Journal and keep an eye on Crypto’s updates. Follow us on Twitter and LinkedIn, and join our Telegram channel to be instantly informed about breaking news!
FAQs
- Why is $98,000 significant for Bitcoin?
It’s a key resistance level; breaking it could signal upward momentum, while failure may lead to a pullback. - What happens if Bitcoin breaks $98,951?
A breakout could push BTC toward $100,000. If not, it might drop to the $96,000–$95,000 range. - What do technical indicators suggest?
Indicators show mild bullish momentum with neutral trends and support at $96,688. - Can Bitcoin hit $100,000 soon?
Yes, if $98,951 breaks and volume increases. Otherwise, consolidation or a pullback is likely.


