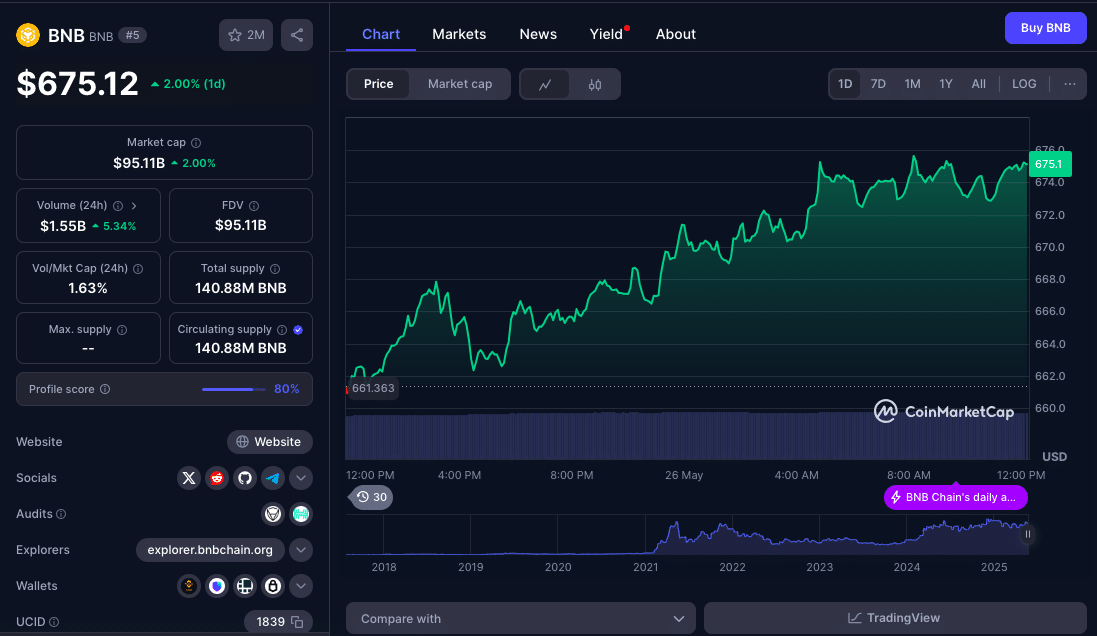
Binance Coin (BNB) is showing resilience as it holds steady above the crucial $660 support zone, hinting at a possible recovery after recent market turbulence. The BNB price has faced intense volatility, as a result of the crypto market’s uncertainties. Traders and investors are closely watching whether BNB can clear nearby resistance levels and embark on a sustained upward trajectory.
Recent data indicates BNB’s price recovered from a low near $652, moving above key resistance levels at $655 and $665. A break above a descending trend line with resistance at $665 was confirmed, showcasing early signs of bullish momentum. However, challenges remain, particularly with BNB’s struggle to break past the $675 resistance and the 100-hour simple moving average.
Support Zones Defend BNB’s Upside Potential
BNB’s ability to consolidate above $660 has become a focal point for traders. According to on-chain data from Binance, a firm base was established above $652, which triggered a rebound. The rebound included a move above the 23.6% Fibonacci retracement of the recent drop from $691 to $653. Binance’s hourly chart shows the price hovering near $672, aligned with the 50% Fibonacci level of that same decline. However, BNB price currently trades at $675, up by 2% in the last 24hrs.
A clear break above $677 could drive BNB price higher, potentially retesting $680 and even $685. As per data from Coinglass, open interest in BNB perpetual contracts has seen a slight uptick, reflecting renewed market confidence.
Technical indicators reinforce this cautious optimism. The hourly MACD for BNB/USD is gaining bullish pace, while the hourly RSI stands above the 50 mark. However, traders remain wary of possible reversals if BNB price fails to clear resistance zones effectively.

Technical Analysis: Path to $700 or More Losses?
If BNB can clear $680 and close above $685, technical indicators suggest a pathway toward $700. However, resistance levels at $675 and $680 are critical. Failure to maintain above $660 could spell trouble, with downside targets at $655 and $642.
Hourly technicals show the MACD trending bullishly but at risk of divergence; RSI currently above 50, indicating balanced momentum, Key supports at $662, $655 and Key resistances: $672, $680.
These signals reflect a market at a crossroads, where momentum needs to solidify to break through resistance and avoid potential downside risks.
Despite recent gains, BNB price continues to face resistance at $675, which has proven a significant barrier in the short term. Market data suggests that a break above this level would need to coincide with broader market sentiment, particularly as Bitcoin and Ethereum show mixed signals.
Market Sentiment: Whales and Retail Traders Diverge
Whale activity around BNB has intensified, with on-chain data from Santiment highlighting increased transfers to centralized exchanges. However, retail traders have adopted a cautious stance, reflecting concerns about potential corrections. Binance’s internal reports indicate that while institutional wallets have increased exposure to BNB, retail sentiment remains mixed.
Retail participants are treading carefully, balancing optimism with skepticism. Until there’s clear confirmation, volatility is expected to persist.

Regulatory Watch: Global Scrutiny Puts Pressure on Binance and BNB
Amid price action, regulatory developments remain a shadow over Binance and its native token, BNB. In May 2025, the U.S. Securities and Exchange Commission (SEC) and Commodity Futures Trading Commission (CFTC) intensified their investigations into Binance’s global operations. In Europe, the implementation of the Markets in Crypto-Assets Regulation (MiCA) has forced Binance to revise its regional compliance strategies.
“The pressure on Binance to meet evolving global regulations cannot be understated,” said lawyer and compliance specialist David Yermack. “BNB’s price resilience amid these challenges is notable, but regulatory risks remain a major concern for investors.”
These headwinds show the importance of clear breakouts above resistance levels, as a prolonged struggle below $675 could signal market hesitancy amid legal uncertainties.
Conclusion: Can BNB Break Free from Resistance?
BNB price action in the coming days will be critical. The ability to stay above $660 and push past $675–$680 could define its short-term trend. With regulatory pressures, shifting market sentiment, and volatile technical signals, BNB price remains a closely watched indicator of broader crypto market resilience.
Follow us on Twitter and LinkedIn, and join our Telegram channel.
FAQs
What is BNB’s current support level?
BNB’s primary support is near $662, with a stronger floor at $655.
What resistance levels does BNB face?
Key resistance levels are $672 and $680, with $685 and $700 potential upside targets if momentum strengthens.
Why is BNB struggling to break resistance?
BNB faces technical resistance amid broader market indecision and regulatory pressures on Binance.
Could BNB drop below $650?
A break below $655 could open the door to a drop toward $650 or even $642 if bearish momentum intensifies.
Glossary
BNB (Binance Coin): Native token of Binance, used for trading fee discounts and other platform utilities.
MACD (Moving Average Convergence Divergence): A technical analysis tool for identifying trend direction and strength.
RSI (Relative Strength Index): Measures momentum by comparing recent gains and losses.
Fibonacci retracement: A Technical analysis tool indicating potential reversal levels in price movements.
MiCA (Markets in Crypto-Assets Regulation): EU framework for regulating digital assets.


