According to recent market data, BNB price trades within a defined range, facing resistance near $700 while holding support above $620. The asset’s price volatility has tightened, with technical indicators suggesting potential shifts in market sentiment. On-chain metrics show mixed signals, making key resistance and support levels crucial for traders.
BNB Price Shows Indecision Amid Market Uncertainty
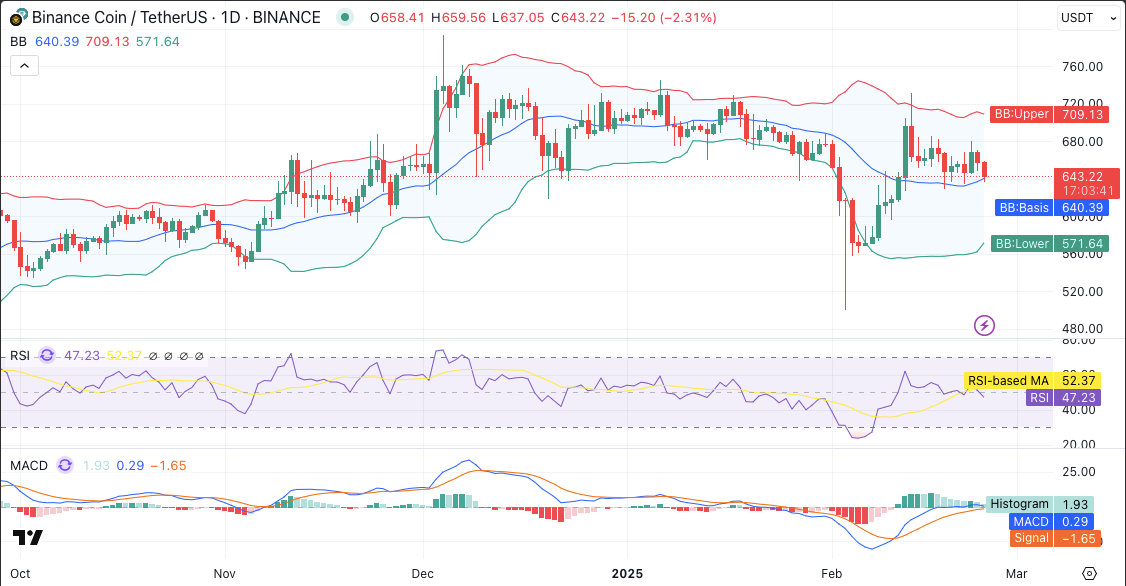
BNB’s price trajectory indicates indecision among buyers and sellers, leading to a neutral market outlook. An uncertain market appears from the Moving Average Convergence Divergence (MACD) indicator, since it has a positive histogram at 1.93 and a negative signal line at -1.65. If the MACD turns positive, it could confirm an upward trend, whereas continued divergence may keep BNB in consolidation.
The RSI stands at 47.23, placing BNB in a neutral zone with no clear buying or selling pressure. The moving average of 52.37 indicates that the RSI shows bearish trends in its current position. The price will likely continue to drop if the RSI falls below 40 but will experience upside momentum if it rises above 55.

Bollinger Bands suggests BNB is trading near its basis level of $640.39, signifying a consolidation phase. Two important breaking points exist at $709.13 and $571.64, forming the upper and lower bands. Trader validation of a bullish rally arises from upper band breaks while descending below the lower band indicates continuing negative price action.
BNB Liquidations Rise as Price Fluctuates
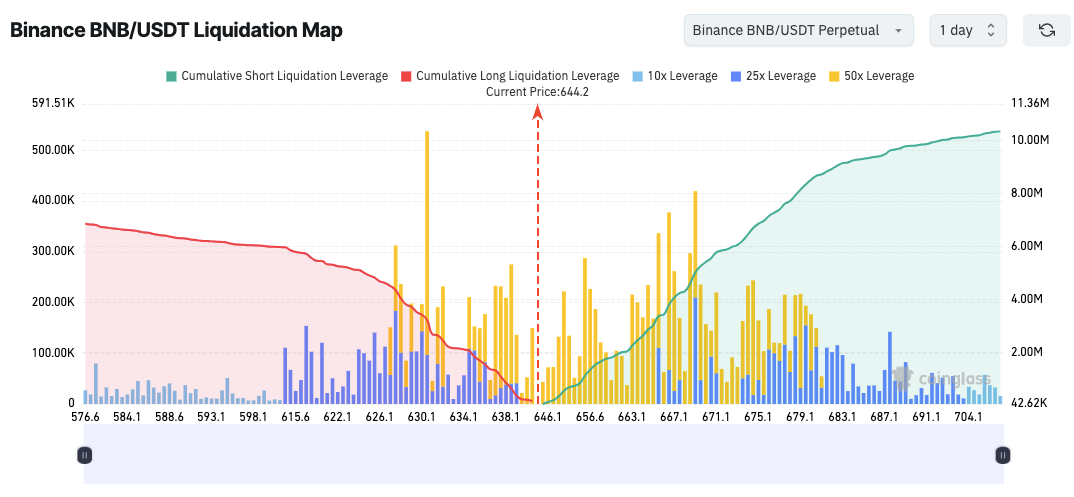
BNB’s price movements have triggered an increase in liquidations, with the current price hovering around $644.2. An analysis of liquidation maps shows large numbers of long position liquidations beneath present price levels due to unexpected events among leverage traders. The $656-$675 area shows rising cumulative short liquidations because a price breakout at that point would likely produce more price movement.
Market volatility continues rising due to leveraged trades using 10x and 50x positions in settings where the liquidation zones exist. The area spanning from $630 to $638 shows intensified past liquidations, which represents a major cluster. Additionally, leverage trading intensifies as BNB moves toward $670-$690, signaling a key resistance zone where further liquidations may occur.

Market players should track support and resistance zones since rising liquidation risks have become more prevalent. Any movement of price below $630 could initiate more long liquidations, strengthening selling activity. The price will likely surge to more than $690 after a short squeeze from when traders push the market through the $670 threshold.
Selling Pressure May Push BNB Lower
If BNB maintains momentum above $680 and surpasses $700, a rally toward $740 could materialize. An increase in trading volume alongside Binance-related operational news will help strengthen an upward price movement for BNB. Continuous buying activities at elevated price points will strengthen market sentiment.
Failure to hold $640 could increase selling pressure, pushing BNB toward $620. If the price breaks from its present position, support at $580 would emerge, indicating declining bullish sentiments. Prolonged downward risks will occur if investors refrain from purchasing BNB.
Conclusion
BNB’s price action remains within a critical range, with volatility driven by technical indicators and liquidation pressures. The asset will experience a substantial price change based on the two vital price points of $630 and $670. The current market calls for traders to exercise caution because major price movements likely result from upward or downward breakouts.
FAQs
What is Binance Coin (BNB)?
Binance Coin (BNB) is the native cryptocurrency of the Binance ecosystem, used for trading fees and various utilities.
What does a neutral RSI indicate?
A neutral RSI means the asset lacks strong buying or selling momentum, leading to consolidation or range-bound trading.
How do Bollinger Bands help in trading?
Bollinger Bands highlight potential breakout and breakdown levels by measuring price volatility.
Why are liquidation zones important?
Liquidation zones show where leveraged traders might be forced to close positions, influencing price volatility.
What happens if BNB breaks above $700?
A breakout above $700 could trigger further buying momentum, pushing the price toward $740 or higher.
Glossary
MACD: A trend-following indicator that helps identify market momentum.
RSI: A momentum oscillator that measures the speed and change of price movements.
Bollinger Bands: A volatility indicator showing price ranges and potential breakout levels.
Liquidation: The forced closing of a leveraged position due to insufficient margin.
Short Squeeze: A rapid price increase due to short sellers covering their positions.


