Binance Coin (BNB) is holding strong above the $655 level, signaling growing confidence from bulls aiming to break above immediate resistance. Backed by steady volume and a bullish pattern formation, the current BNB price prediction anticipates a move toward $680–$700; if key resistance at $662 gives way.
As broader market sentiment improves alongside Bitcoin and Ethereum, BNB has quietly formed a base that could power the next upward leg. However, short-term risks remain if it fails to hold critical support zones.
Bulls Defend Support: Technical Foundation Strengthens
BNB’s rally began after finding strong demand near $620. This zone has historically acted as a switch, and the recent bounce confirms ongoing interest at that level. Buyers stepped in quickly, pushing the price above the $645 and $650 resistance levels. On Sunday, BNB reached an intraday high of $666 before retracing slightly.
Now trading at $661, BNB is consolidating within a contracting triangle, with resistance aligning at $662, according to Binance and Kraken spot data.

The technical setup shows growing pressure for a breakout. The MACD on the hourly chart is gaining pace in the bullish zone, while the RSI remains well above 50, suggesting strength without yet signaling overbought conditions.
Key Levels to Watch: Resistance and Support Zones
With BNB’s price action forming a bullish continuation structure, traders are closely monitoring breakout and fallback zones. If BNB clears $662, the next targets lie at $672, followed by $680. A successful push beyond this range could see a run toward $700, especially if accompanied by strong trading volume.
Failure to breach resistance, however, could trigger another retest of support at $655, with deeper zones at $650, $644, and potentially $632 if momentum fades.
BNB Price Prediction Table
| Level | Price (USD) | Role |
| Immediate Resistance | $662 | Triangle top and breakout trigger |
| Minor Resistance | $665 | Overhead hurdle after triangle breakout |
| Next Bull Target | $672 | Post-breakout Fibonacci level |
| Major Resistance | $680 – $700 | Long-term target zone |
| Short-Term Support | $655 | 100-hour SMA and consolidation floor |
| Key Support | $650 | Fib level and historical consolidation |
| Deeper Support | $644 – $632 | Sell-off risk zone if $650 fails |
| Macro Support Floor | $620 | Long-term pivot and recovery base |
Volume and Sentiment Align
A key indicator backing this bullish setup is the rising open interest and increasing spot volume. According to BraveNewCoin, BNB’s derivatives open interest surged from $3.5M to $6.1M in less than 48 hours, signaling renewed trader conviction. Spot trading volume also exceeded $568 million, indicating strong demand behind the recent price action.
These metrics, paired with rising RSI and MACD signals, reinforce the possibility of a breakout; if bulls can hold the line and push past resistance.
Outlook: Is BNB Ready to Retest $700?
BNB has now spent several sessions testing the boundaries of its consolidation pattern. With macro tailwinds from Bitcoin’s strength above $108,000 and Ethereum regaining the $2,550 zone, BNB’s performance is part of a broader altcoin recovery.
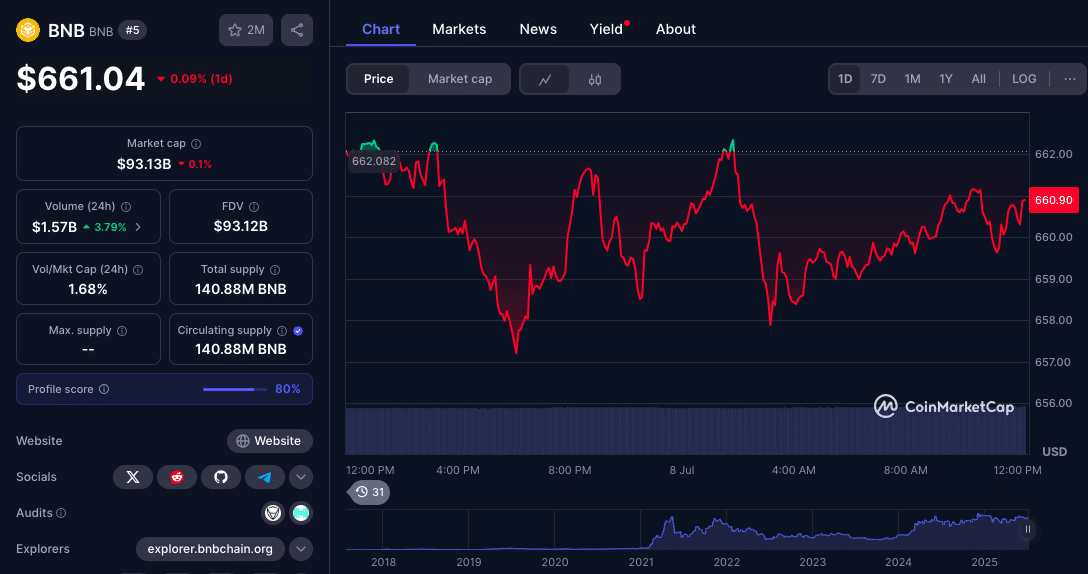
If bulls maintain control and break the $662–$665 zone with volume, the path toward $680 becomes viable. A sustained move could eventually challenge the $700 barrier; something not seen since early Q2 2024.
On the flip side, a breakdown below $655 could expose BNB to a pullback toward $650 or lower, especially if broader market momentum stalls.
Conclusion: Watch $662 Closely
The current BNB price prediction leans bullish, contingent on a breakout above $662 resistance. The coin has rebounded firmly from $620 and is now building strength near a critical inflection zone.
If bulls can deliver volume-backed momentum, targets between $672 and $700 come into focus. Until then, $655 remains the line in the sand.
Follow us on Twitter and LinkedIn, and join our Telegram channel.
Summary
BNB is trading at $661, preparing for a potential breakout above $662. The MACD and RSI confirm growing bullish momentum, and derivatives open interest has nearly doubled, signaling increased trader conviction. A successful push above $665 could open the door to $672 and possibly $700. However, failure to hold $655 may see BNB revisit $650, with deeper support at $644 and $632. The current BNB price prediction remains bullish, but sustained volume is essential.
FAQs
What is the current resistance level for BNB?
BNB faces immediate resistance at $662, with further hurdles at $665 and $672 if momentum builds.
Is BNB showing bullish momentum?
Yes, the MACD is in bullish territory and the RSI is above 50, supporting the current uptrend.
Where could BNB fall if the rally fails?
Key downside levels include $655, $650, $644, and potentially $632 if selling accelerates.
Is $700 a realistic target this week?
Only if BNB breaks above $665 with sustained volume. Without that, a move toward $700 remains speculative.
Glossary
MACD (Moving Average Convergence Divergence): A trend-following indicator that signals momentum shifts.
RSI (Relative Strength Index): A momentum indicator measuring overbought/oversold conditions.
Fibonacci Retracement: Levels based on key ratios used to identify support/resistance.
Open Interest: Total number of outstanding contracts in derivatives markets.
100-Hour SMA: A moving average commonly used to assess short-term trend strength.
Sources


