Chainlink (LINK) has been garnering much of the market’s focus owing to its consolidation and the possibilities of breaking out. At the time of writing, LINK is priced at $19.10, highlighting a 4.84% fall in the last 24 hours. The price formation of LINK has depicted a strength inside a descending wedge pattern which is generally associated with a bullish breakout.
The $23.92 is an important ceiling that Chainlink has to break through to show further upward momentum. A surge past this point could pave the way to an upside move towards $30, a price point that may find more attention from the trading and investing community. Still, a failure to break through this resistance could lead to an extension of the consolidation phase and a further hold-up of the upward move.
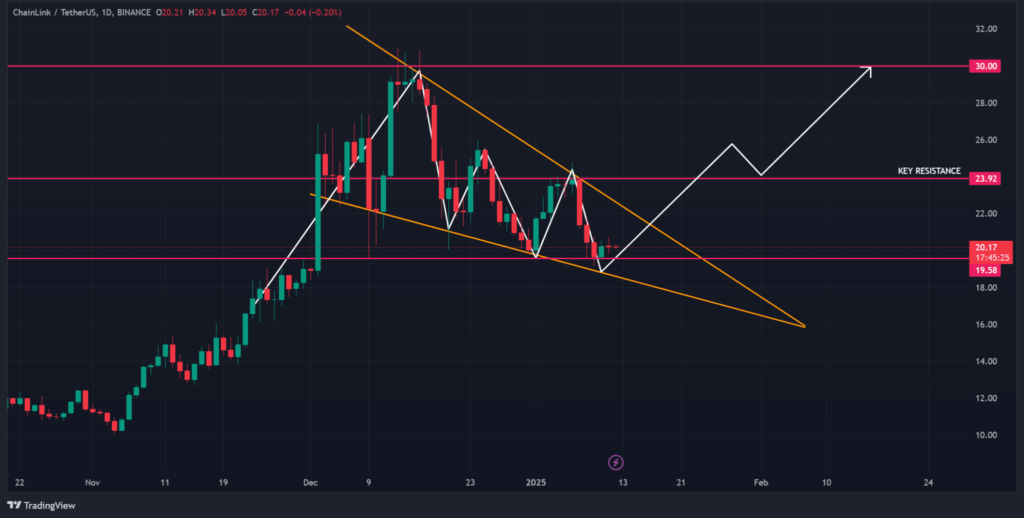
The descending Wedge pattern, characterized by a series of lower highs and little by little lower lows, is a formation many traders look at as a potential bullish move. As the price reaches the top part of this formation, the probability of a price breakout rises, and expectations of further LINK’s movement become more vivid.
Chainlink Rising Network Activity
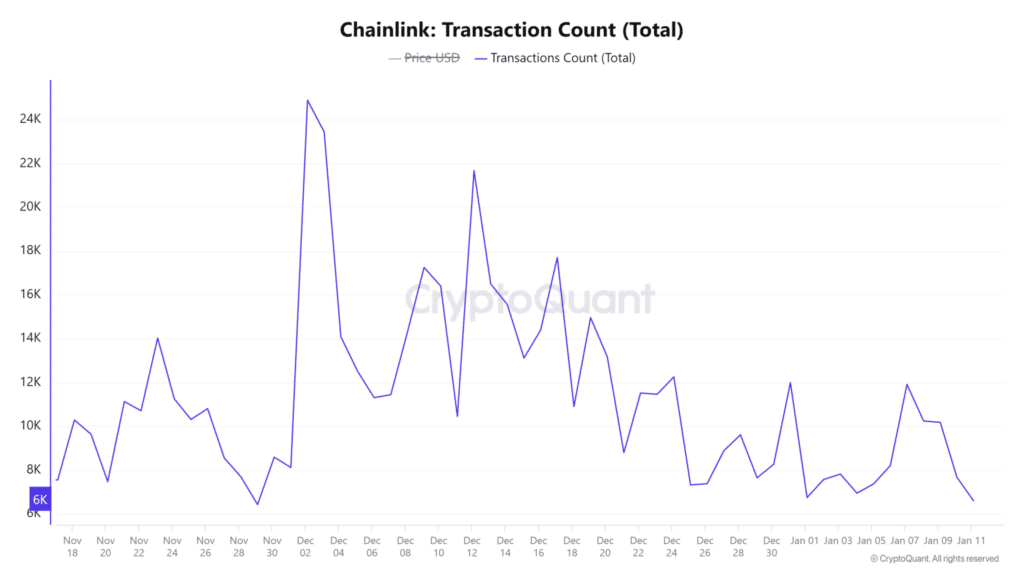
The on-chain data has also supported the idea that Chainlink is capable of experiencing further growth. The active addresses on the network have risen by 0.86 % in the last one day therefore depicting increased user interactivity. Also, transaction volume increased by 0.88% to show that there was heightened traffic and more demand for LINK tokens.
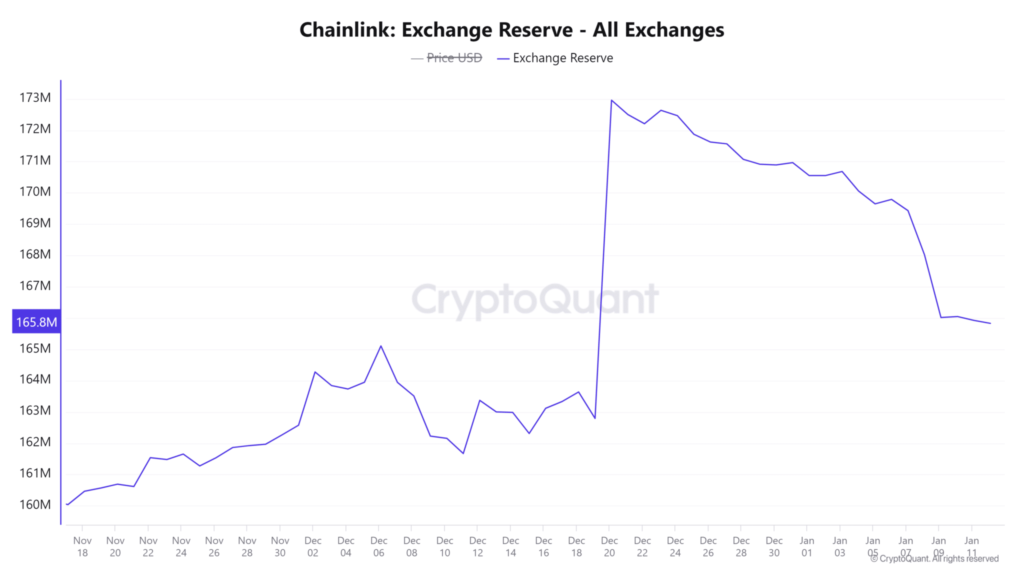
The exchange reserves for LINK have also gone down by 0.11%, which could be taken as less selling pressure, as fewer tokens are held in exchanges. This makes the supply and demand situation much more conducive to price increase. These metrics combined represent a strengthening demand for Chainlink, which is imperative for the continuation of any upward trend.
Bullish Market Sentiment
The market sentiment for the LINK has seen a bounce with the open interest increasing to $724.59 million by 5.42%. This rise shows more openness and involvement of the traders which supports the bullish view. Also, the liquidation data show that the number of short positions exceeds the number of longs, which means that the expectation of market participants has become more positive.

If Chainlink manages to climb over the $23.92 level, it may open up the way to $30 or even more. This level is considered to be a critical psychological and technical marker that will most probably bring new interest to the market. However, in the case where the breakout attempt fails, the LINK may stay in a consolidation pattern, and the near-term trend is hard to predict.
The data of Chainlink’s on-chain metrics and market sentiment indicate the existence of powerful fundamental factors that could drive price growth. The trend on active network engagement, decrease in selling pressure, and increase in open interest is a good platform for a possible bullish breakout.

The market trends will also influence the further direction of LINK’s growth. It was also likely to enjoy a surge in its trading volume and could be boosted or slowed down by external market forces.
Conclusion
The next few days will be critical for the coin as the LINK is near the apex of the triangle pattern. A break above the resistance level is likely to trigger sharp gains, which will attract short-term traders and long-term investors. However, sustained mergers and acquisitions could put the market on the wheel, which may lead to a temporary stagnation of the market.
For investors and traders, the main attention will be paid to the LINK’s performance against the $23.92 resistance level. This level will most probably define if Chainlink is to begin an incline or endure a long phase of stagnation. Since the market confidence is increasing, the LINK is expected to make a step change in the near future.
The BIT Journal is available around the clock, providing you with updated information about the state of the crypto world. Follow us on Twitter and LinkedIn, and join our Telegram channel.
FAQs
What is the significance of Chainlink’s descending wedge pattern?
The descending wedge pattern indicates a potential bullish breakout as prices approach the apex.
Why is $23.92 a critical level for Chainlink?
Crossing $23.92 could lead to a rally toward $30, drawing attention from traders and investors.
How do on-chain metrics reflect Chainlink’s growth?
Rising active addresses and reduced exchange reserves highlight increased demand and lower selling pressure.
What happens if Chainlink fails to break resistance?
Failure to break resistance may extend the consolidation phase and delay upward momentum.
