Aave (AAVE) is now on the rise due to the anticipation that comes with growth in the cryptocurrency market, particularly coupled with inflationary indicators such as the Consumer Price Index (CPI) and the Producer Price Index (PPI). The DeFi token appreciated by 6.47% in the last 24 hours and the token is valued at $260.98. AAVE has also surged by 1.69% in the past week which is an indication of rising investors’ interest.
AAVE’s Market Overview
AAVE has a circulating supply of 16th million tokens, making its market capitalization about $3.93 billion. The 24-hour volume amounts to $327.29 million, showing that for clients, the market was quite active during the period under review. This is due to the growing trader interest, and their observance of the AAVE position as macroeconomic factors impact the cryptocurrency market.
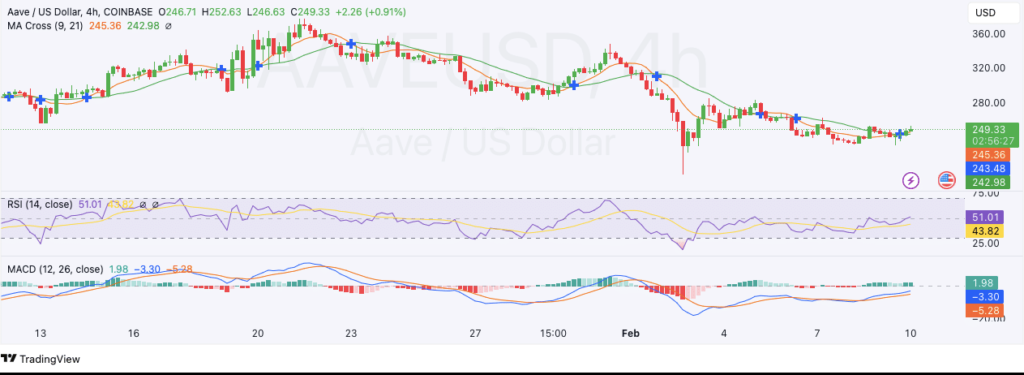
The technical outlook for AAVE has remained positive due to its price being above the key moving averages. The moving average for the 9-period is $245.64 while the 21-period moving average is $243.10. This bullish crossover points towards short-term strength, the first resistance level is at $262 while the first support is at between $243.50-$245.
RSI and MACD Reflect Stable Market Conditions
The technical analysis reveals that AAVE is still moving in a sustainable manner, as per technical parameters. The Relative Strength Index (RSI) stands at 52.95 in a medium level, which means that the commodity is not overbought or oversold. This position can also be considered non-bullish or non-bearish but with the opportunity for an upward or downward movement. On the same note, the Moving Average Convergence Divergence (MACD) indicator is slightly bullish having a MACD value of 2.14, which is above the signals value of -3.10.

Decline in Open Interest
According to data from analytical platform Coinglass, AAVE’s Open Interest (OI) is down by 2.21% and is currently worth $213.97 million. Open Interest which measures the number of active derivative contracts has progressively reduced the upward trend recorded close to $ 500 Million between October and December. This is in line with the current downward trend of AAVE’s price oscillation within the range of $214 to $271, which signify that traders are cutting their leveraged exposures.

Large Transactions Experience Downtrend
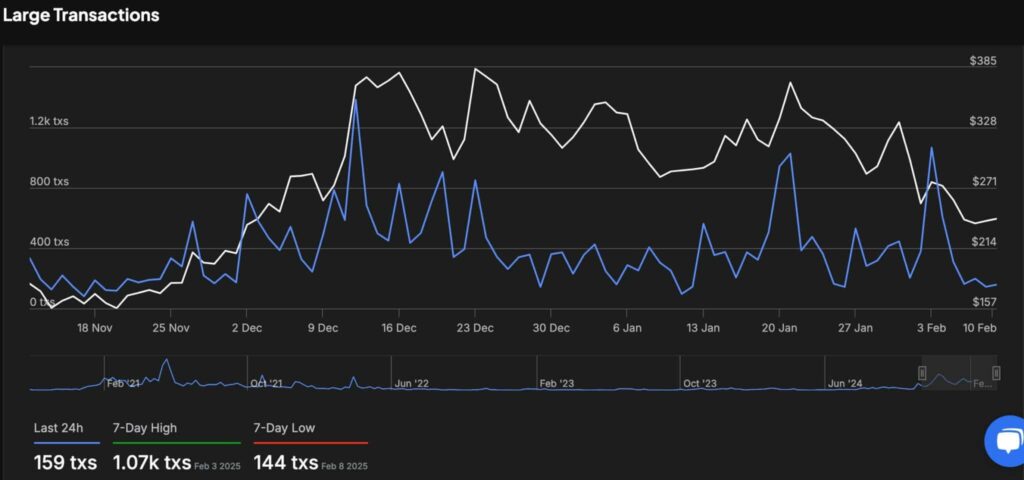
The analysis of on-chain data has shown a significant decline in larger transactions ≥$100,000. For the past 24 hours, 159 large transactions were registered. The highest volume was recorded at the end of the first week on February 3, at 1,070 transactions and the lowest volume was experienced on the second week second week at 144 transactions. The reduction in whale activity could mean that there is a buildup taking place or less institutional investors are participating.

Aave Market Sentiment
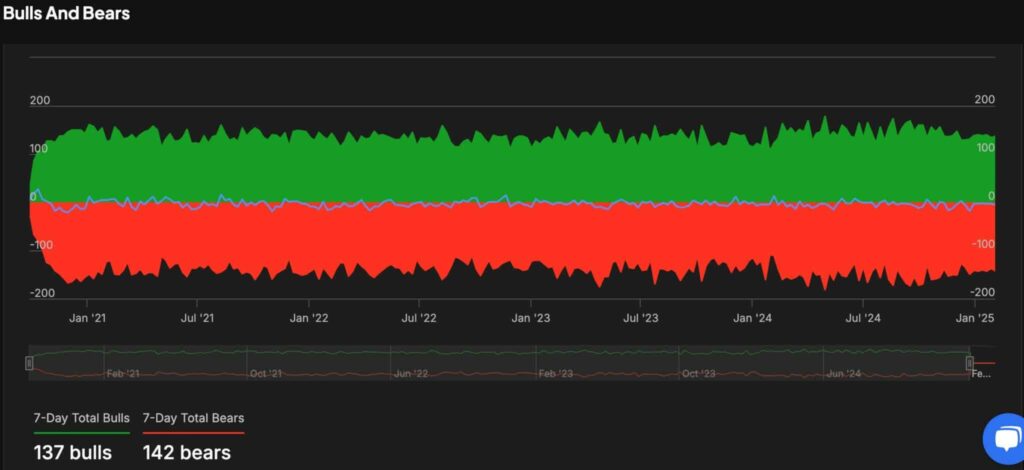
The sentiment analysis also points towards AAVE having a neutral or even slightly positive outlook. In the past week, 137 bullish calls were filled as opposed to only 142 bearish calls, which are very close in ratio. In general, the trends in sentiment have been mixed, meaning that the markets did not have any clear lean toward bullishness or bearishness. This means that investors remain patiently waiting for price triggers that will encourage them to invest in long-term trades.

As CPI and PPI figures are expected to be released, the price movement of AAVE will be influenced by the general macroeconomic environment. This figure is lower than predicted and can increase investor confidence to push AAVE past the resistance level. On the other hand, inflation rates slightly above the projected figures may generate short-term fluctuations in value that may prompt traders to realign their positions accordingly.
Key Levels to Watch
The first level of resistance for AAVE is at $262, whereas the initial level of support is between $243.50 and $245. In this case, further upward movement may continue and push the token through the resistance level with targets within the $270-$280 range. Nonetheless, a downturn may lead to renewed selling pressure and test the lower support figures, with the $214-$220 range being key.
Conclusion
A current Aave price action indicates increased demand in the market through fundamental technical analysis. While the asset is consolidated, traders pay attention to price patterns as economic indicators and data are released. Due to the decline in Open Interest and a large number of transactions, further development can be determined by external conditions, which indicates a rather volatile market. The key areas to look for a breakout is at $262 and $243.50 a level that is considered as resistance and support, respectively.
The BIT Journal is available around the clock, providing you with updated information about the state of the crypto world. Follow us on Twitter and LinkedIn, and join our Telegram channel.
Frequently Asked Questions (FAQ)
Why is Aave (AAVE) experiencing an upward trend?
Aave is rising due to increased investor interest and market anticipation surrounding inflation indicators like CPI and PPI.
What are AAVE’s key resistance and support levels?
The first resistance level is at $262, while support lies between $243.50 and $245.
How is AAVE’s market sentiment shaping up?
Market sentiment remains neutral to slightly bullish, with nearly equal bullish and bearish positions recorded over the past week.
What does the decline in Open Interest indicate?
A drop in Open Interest suggests traders are reducing leveraged positions, leading to a more cautious market environment.
Appendix: Glossary of Key Terms
Consumer Price Index (CPI): A measure of inflation that tracks the average price changes of goods and services over time.
Producer Price Index (PPI): An economic indicator that measures the average change in selling prices received by domestic producers for their output.
Moving Average (MA): A technical indicator that smooths out price fluctuations by averaging past prices over a specific period.
Open Interest (OI): The total number of outstanding derivative contracts that remain unsettled, such as futures or options.
Resistance Level: A price level where selling pressure is expected to prevent further upward movement.
Support Level: A price point where buying interest helps prevent further declines in an asset’s price.
References
AMB Crypto – ambcrypto.com
TradingView – tradingview.com
CoinMarketCap – coinmarketcap.com
CoinGlass – coinglass.com
IntoTheBlock – intotheblock.com


