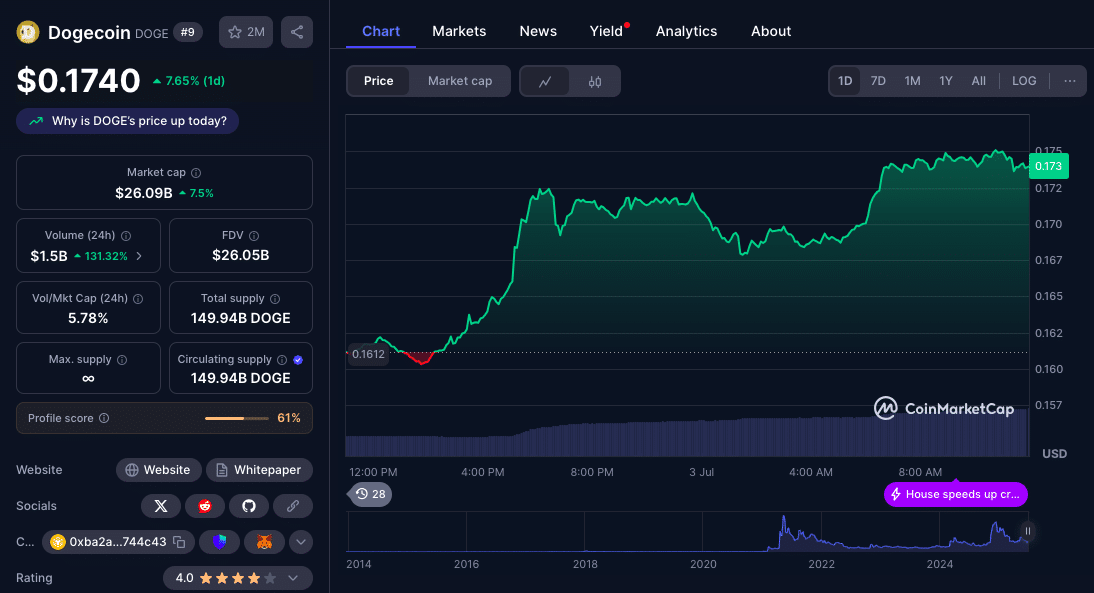
Dogecoin is back in the headlines after a modest but promising bounce off recent lows. The coin has rebounded from the $0.1565 support level, climbing above key resistance zones to retest the $0.170 region. While the latest momentum hints at further upside, analysts caution that DOGE remains under pressure unless it can convincingly breach the $0.180 mark; a psychological barrier that has capped previous rallies.
As traders weigh short-term risks against long-term optimism, the question remains: where is Dogecoin price prediction really headed from here?
DOGE Sees Fresh Recovery, But Momentum Wanes Below $0.1720
Dogecoin price action over the past week mirrored the crypto market recovery. Starting from a swing low of $0.1565, DOGE managed to rally through multiple resistance levels, including $0.1600, $0.1620, and the more critical $0.1650 threshold. A notable bullish development occurred as DOGE broke above a key descending trendline at $0.1640 on the hourly chart; signaling a shift in short-term sentiment.
As at the time of this publication, DOGE is trading at $1740.

Technical Levels to Watch: Support and Resistance Zones
Dogecoin currently trades just above the 23.6% Fibonacci retracement level from the $0.1565 low to the $0.1740 high. Immediate resistance lies at $0.1710, followed by stronger resistance at $0.1720 and $0.1750. A decisive move past $0.1750 could lead to a test of $0.180 and potentially $0.200, if volume supports the breakout.
On the downside, initial support is near $0.1650, with the 50% Fibonacci level ($0.1645) providing an additional cushion. A failure to hold these levels could drag DOGE back toward $0.1620 and possibly even $0.1560, which now serves as the key support floor.
Market Sentiment: Meme Coin or Legitimate Asset?
While Dogecoin continues to face criticism, its community-driven strength and growing institutional interest are difficult to ignore. Data from sources shows an uptick in on-chain activity and wallet addresses holding DOGE long-term.
That said, the current recovery lacks the kind of volume spikes that typically precede massive breakouts. Retail interest in meme coins has cooled significantly in Q2 2025 compared to the frenzy seen in 2021 or early 2024. Until DOGE sees renewed investor enthusiasm, possibly sparked by a broader altcoin rally or surprise fundamental developments, sustained price growth remains an uphill battle.
Expert Forecasts: What Analysts Say About DOGE in 2025 and Beyond
Dogecoin price prediction remains a hot topic among analysts. While few expect a return to its $0.70 all-time high anytime soon, some forecasts suggest steady upside potential if DOGE maintains support above $0.150 and successfully flips resistance levels. Here’s what experts are saying:
| Source | 2025 Forecast | 2030 Forecast |
| WalletInvestor | $0.17 – $0.22 | $0.30 – $0.45 |
| DigitalCoinPrice | $0.19 – $0.24 | $0.50 – $0.60 |
| CoinCodex | $0.18 – $0.23 | $0.42 – $0.55 |
WalletInvestor maintains a conservative stance, noting DOGE’s high volatility and meme-based reputation. DigitalCoinPrice sees moderate growth, citing strong community support and broader crypto adoption. CoinCodex predicts DOGE will benefit from continued integration into payments.
Still, all Dogecoin price prediction agree on one essential point: breaking and holding above $0.180 is required for any medium-term bullish thesis.
Key Drivers for Dogecoin’s Price Movement
Several factors could impact Dogecoin’s trajectory in the coming weeks:
Market-wide Sentiment: Bitcoin dominance remains high, and altcoins like DOGE tend to follow BTC’s lead. A bullish BTC could lift DOGE above resistance zones.
Elon Musk Influence: While less frequent, tweets and endorsements from Musk, DOGE’s unofficial mascot, still carry weight and can trigger spikes in price.
Utility Growth: Dogecoin’s adoption for payments, especially through integrations with online retailers and social platforms, could give the coin more real-world use cases.
Regulatory Clarity: In the U.S. and beyond, clearer rules on crypto assets could help DOGE gain legitimacy and attract more institutional capital.

Is $0.180 a Turning Point for DOGE?
Dogecoin’s recent rally reflects renewed optimism, but without a break past $0.180, it may just be another short-term bounce. Technical indicators remain mixed: the hourly RSI is above 50, suggesting mild bullish control, but the MACD shows signs of slowing momentum. Bulls will need a catalyst to turn this consolidation into a full breakout.
Until then, Dogecoin remains range-bound, with traders watching key levels and volume closely.
Conclusion: Patience or Pullback?
Dogecoin has proven time and again that it can defy expectations, fueled by a loyal community and viral moments. But in the current market, utility, structure, and sentiment matter more than hype alone. A breakout above $0.180 could open the door to more gains, but the resistance remains firm for now. With multiple support zones below, DOGE isn’t in immediate danger, but the next few days will be critical in determining its short-term fate.
Summary
Dogecoin is attempting a recovery after bouncing from $0.1565, with bulls eyeing a break above the critical $0.180 resistance. Currently trading around $0.1740, DOGE’s short-term momentum is stable but limited. Analysts remain cautiously optimistic, forecasting 2025 targets between $0.18 and $0.24, depending on broader market trends and meme coin sentiment. Technical charts show key resistance at $0.1720 and $0.1750. A breakout could push DOGE toward $0.200. Conversely, failure to sustain gains might see a drop back toward $0.1560.
FAQs
Can DOGE reach $0.1800 soon?
If it clears $0.1720–$0.1750 with volume, a move to $0.1800 is likely.
What are the critical support levels?
$0.1650 (100-hr SMA), $0.1620, and $0.1560 as downside supports.
Which timeframe to watch for breakout?
Traders and Investors can watch hourly and 4-hour charts, close above $0.1750 with good volume.
Is DOGE a long-term buy?
If broader meme-coin cycles return and DOGE secures real-world utility or exchange momentum. Traders and investors are advised to do their own research before investing.
Glossary
SMA (Simple Moving Average): Average price over 100 hours.
RSI (Relative Strength Index): A momentum measure; >50 is bullish.
MACD: Momentum indicator showing trend direction and momentum shifts.
Fib Retracement: Price-level tool based on swing highs/lows.


