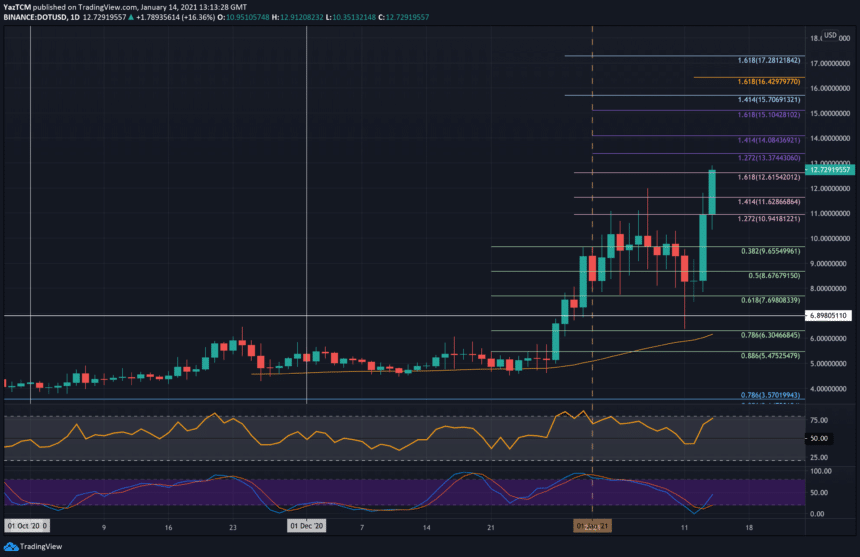
Polkadot’s (DOT) potential technical breakout has investors engrossed in the crypto market. The DOT price recent action has traders and experts hopeful. It appears to have broken out of a falling wedge formation with eyes more upside. This technical pattern, which can indicate a trend change from down to up, is well-known. Polkadot rises to the top as market participants await its next move.
Polkadot’s breakout is notable since Bitcoin (BTC) and Ethereum (ETH) are progressing. According to the DOT price analysis, this may be more than a temporary swing. It may indicate how the market feels about this groundbreaking blockchain technology. Many have seen great promise in Polkadot’s innovative parachain design and emphasis on interoperability. DOT’s fundamental strengths are converging with its technical indications. Therefore, investors monitor to see if it can ride this wave of positive momentum and achieve further upside in the coming weeks.

Technical DOT Price Analysis: Understanding the Falling Wedge Pattern
The recent surge in DOT price has allowed it to break out from the trending falling wedge pattern that has been in place since March. A falling wedge is a bullish chart pattern which takes a wide peak and narrows down into a cone shape as prices go down. A reversal pattern like this may signal the end of a downward trend and the start of an upward one.
On July 13, Polkadot broke free of this upper line and has risen since then. DOT price has been following the wedge pattern of lower highs and lows. There appears to be a breakout above the top trendline based on the present price movement. Strong upward movements following such breaks typically indicate a change in momentum from bearish to positive.
Investors have taken notice of the most recent breakout above the falling wedge’s top trendline. According to World of Charts, “Seems like #DOT is ready after correction formed fallow wedge in H12Tf successful breakout can lead massive bullish wave towards $12.” The fact that the Parabolic SAR indicator’s dots are below the price of DOT confirms the optimistic attitude following the stock. With sustained demand, Polkadot might rise to a price point higher than $6.57. The price of the currency can drop to $6.0 if the positive trend fails to gain traction.

Notably, the key aspects of the DOT price analysis include volume confirmation. Significantly higher trading volume on Polkadot occurred alongside the breakout, lending credence to the pattern breakout’s veracity. The RSI, or Relative Strength Index, is also a part of it. RSI, which monitors momentum, surged strongly after the breakthrough. There appears to be growing interest in purchasing DOT shares, which could mean the price has further room to rise.
Although the DOT price analysis shows positive indications based on available data, it is essential to remember that the cryptocurrency market is still very unpredictable. This implies that while there is a positive outlook, it can be influenced by outside forces. The market behaviour and, thus, the price action of cryptocurrencies like Polkadot are very susceptible to the behaviour of market leaders. Such leaders affecting other coins’ prices include Bitcoin (BTC) and Ethereum (ETH).
Conclusion: Potential Impact of DOT’s Price Action
Based on the DOT price analysis, Polkadot may see short- to medium-term gains after breaking out of the falling wedge formation. Nevertheless, weighing this advancement’s pros and cons is essential. According to the DOT price analysis, its future may be at a crossroad. The possible continuation of the recent upswing following the falling wedge formation is contingent on different variables. These include general market circumstances and particular events inside the Polkadot ecosystem.
In the next few days and weeks, investors and traders should pay close attention to volume trends and note the key resistance levels. Monitoring Bitcoin (BTC) and Ethereum (ETH) will assist in grasping DOT price movements. The crypto market is volatile and unpredictable, so it’s important to stay flexible, even while technical research can be useful.
The DOT price analysis should only be seen as one tool among many to make educated investing decisions. Investing in crypto requires, as usual, careful risk management and extensive study. The recent price surge in DOT is cause for celebration. Yet, investors would be wise to maintain a level head in the face of the fascinating but potentially risky crypto market. The BIT Journal closely monitors the DOT price analysis and market action in the coming weeks.


