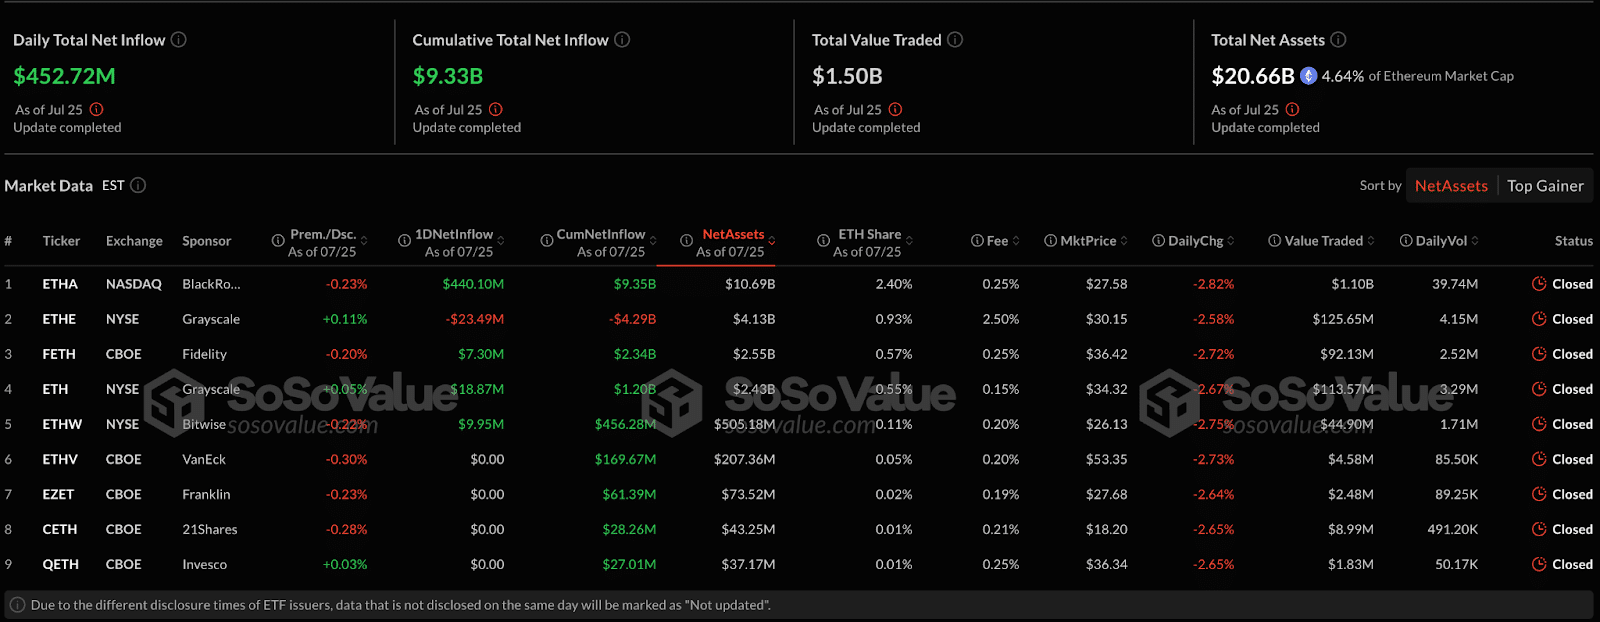
According to the latest reports, Institutional demand for Ethereum has never been higher as spot Ethereum ETF inflows have ticked 17 days in a row, including $453 million on Friday alone. BlackRock’s ETHA ETF led the charge with $440 million in daily inflows, bringing the total ETF asset value to $20.66 billion, or 4.6% of ETH’s market cap.
This is in stark contrast to Bitcoin ETFs which saw only $71 million over the same period. Experts say this institutional conviction is the main factor behind the current bullish technicals and scarcity.
Supply Shock? Forecasts Say Institutional Demand Could Outpace Issuance
Analysts are warning of a supply shock as inflows are far exceeding new ETH issuance. According to Bitwise, inflows over the next year could be $20 billion, or 5.3 million ETH, compared to 0.8 million new ETH being created over that time frame, leading to a7× imbalance.
CME open interest is at $7.85 billion, showing sophisticated traders are positioning for ETH futures. This supports the narrative that institutional capital is locking in ETH bets aligned with the bullish expectations and technicals.
Technical Outlook: Diamond Chart Formation Suggests $4K–$6K
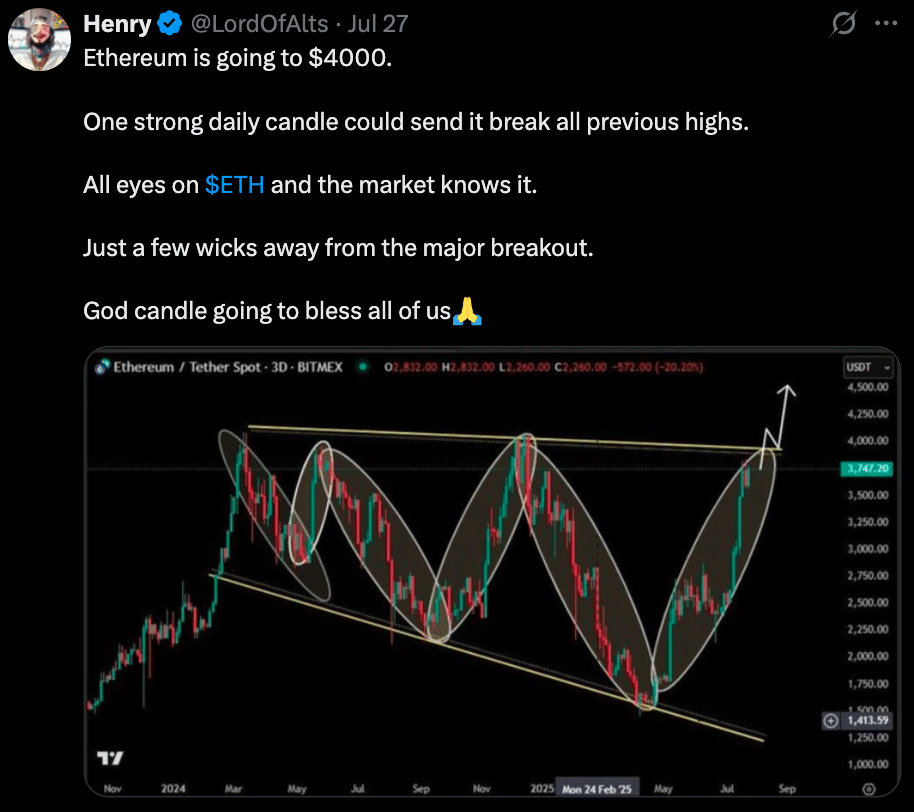
According to experts, Ethereum’s 3-day chart formed a diamond chart pattern with the apex at $2,832. This is one of the most reliable reversal patterns and with the recent volatility between cycle highs near $4,000 and lows near $1,400, the breakout direction is high probability.

Breakout above the diamond’s upper trendline could take Ethereum to $4,000, and further to $6,000 if demand continues. Previous measured moves from similar formations project upside targets as high as $6,500–$7,000.
Seasonality is Bullish in August. In previous times, August had been the best month for ETH post-Bitcoin halving years with average returns of 64.2% from lows around $1,500 to highs near $2,400 in previous cycles. If ETH is at $2,800 at the start of August and repeats the historical norm, experts think it could go to $6,000.
With July gains already up 50%, the combination of ETF inflows, technicals and seasonality is setting up for a big August.
Bull vs Bear: Price Scenarios Ahead
| Scenario | Conditions | Target Price |
| Bull Case | Continued ETF streak, CME near $8B, breakout above diamond pattern confirmed, August seasonality | $4,000–$6,000+ |
| Moderate Case | ETF inflows stabilize, diamond breakout fails, support holds above $2,550 | $3,200–$3,500 |
| Bear Case | ETF inflows slow, negative macro event, break below $2,550 support level | $2,800–$3,000 |
The Bull scenario assumes unchecked demand overwhelms supply and technical confirmation. Moderate case assumes consolidation within current channel. Bear outcome could trigger if external risks disrupt ETF flow or macro sentiment shifts.
Broader Context: Institutional Interest Grows Despite Volatility
Even in a choppy market, institutional interest is strong. Sources previously reported 15-day ETF inflow streak of $837 million, as institutions see ETH as long-term infrastructure not speculative token.
Meanwhile, Ethereum’s Pectra upgrade that took place in May lowered gas costs and increased protocol efficiency, boosting fundamentals for smart contract usage, staking and DeFi adoption. Analysts like those quoted that they are are seeing early signs of a supply crunch as inflow rates far outstrip new issuance.

Experts note that despite Bitcoin’s dominance, favorable regulation and growing ETH ETF activity has Ethereum set up for a potential $5,000+ in the near term.
Conclusion
Based on the latest research, Ethereum ETF inflows are the key to its near term run. The 17-day streak of spot ETF inflows, now at billions of dollars, is creating a supply squeeze that could change everything. Technicals, including the diamond pattern forming at $2,832 and August seasonality, point to a possible breakout to $4,000–$6,000 if momentum holds.
However, any sharp reversal in institutional demand or breach of supports at $2,550 could cap the upside. All signs point to a critical inflection point for Ethereum.
Read Ethereum price prediction.
Summary
Ethereum ETF inflows are breaking out, with institutions buying spot ETH for 17 days in a row and $453 million in one day alone. The demand is threatening to exceed annual ETH issuance by up to 7x. Technicals, specifically the diamond chart pattern at $2,832 point towards a possible breakout to $4,000–$6,000, supported by seasonality.
FAQs
Why is the 17 days of ETF inflows important?
It shows sustained Institutional demand for ETH. $9.3 billion in ETF assets is a record.
How can demand exceed Ethereum supply?
Institutional forecasts predict $20B in inflows next year (5.3M ETH), while expected issuance is only 0.8M ETH.
What is a diamond chart pattern?
A reversal pattern. When confirmed, it often leads to big breakouts to previous highs.
Why is August important foe ETH?
In previous times, ETH rallies 64% in August during post halving years. The current setup increases the odds.
Glossary
Ethereum ETF inflows – Institutional money flowing into spot ETH ETFs.
Diamond Pattern – High probability reversal pattern with volatility expansion and contraction.
Measured Move – Technique to calculate price targets based on chart range.
CME Open Interest – Value and liability of active futures contracts; large numbers mean institutional positioning.
Seasonality – Historical performance of an asset in specific months.


