Ethereum has fallen below the critical $2,000 level for the first time since November 2023, sparking concerns among investors. The drop has also pushed ETH below its November 2024 lows, signaling the possibility of an extended bearish trend. While short-term price action remains weak, some analysts believe Ethereum may see a recovery, driven by key technical levels and upcoming network upgrades.
Key developments impacting Ethereum
Ethereum has been experiencing sustained selling pressure, with its price hovering around $1,860 during the Asian session on Thursday. The crypto market’s overall bearish sentiment has contributed to ETH’s weakness. However, expectations around a potential US spot Ethereum ETF approval are keeping investor hopes alive. If approved, this could trigger institutional interest and bring much-needed upward momentum to Ethereum’s price.
Overview
| Cryptocurrency | Ethereum |
| Token | ETH |
| Price | $1,872 (-2.21%) |
| Market cap | $228.18 Billion |
| Circulating Supply | 120,61 ETH |
| Trading Volume | $19,24 Billion |
| All-time high | $4,891.70 on 16th Nov 2021 |
| All-time low | $0.4209 on 22nd Oct 2015 |
Ethereum futures liquidations on the rise
Data from Coinglass reveals that Ethereum witnessed $43.07 million in futures liquidations in the past 24 hours. Of this, $26.93 million were long liquidations, while short liquidations accounted for $16.14 million. The significant amount of liquidations suggests that traders remain divided on Ethereum’s direction, leading to heightened volatility. This tug-of-war between bulls and bears has prevented Ethereum from establishing a clear price trend.

Strong resistance levels could stall recovery
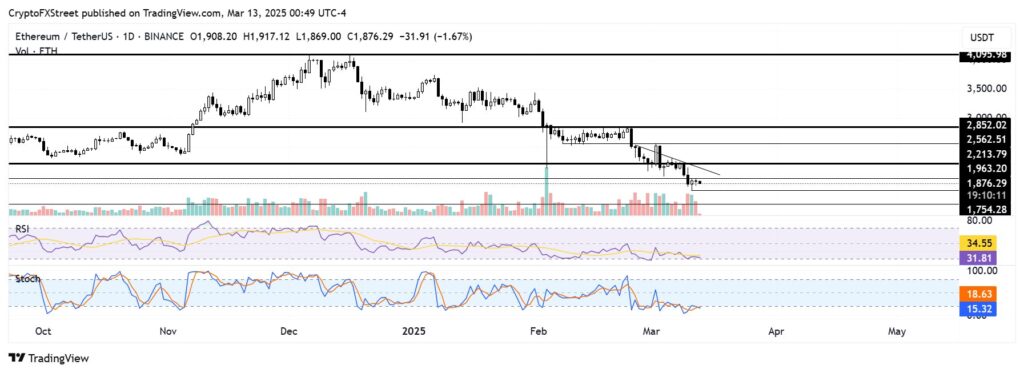
Ethereum’s price lacks clear directional momentum, as both buyers and sellers are struggling to take control. The cryptocurrency is currently facing major resistance at $1,960, which coincides with a key descending trendline. A breakout above this level could give ETH the strength needed to reclaim the $2,200 mark. However, if the price continues to consolidate between $1,900 and $2,000, this range could become a crucial resistance area that ETH must overcome before staging a sustained recovery.

Technical Indicators Show Bearish Momentum
Ethereum’s technical indicators remain weak, reinforcing the prevailing bearish trend. The relative strength index and stochastic oscillator are near oversold levels, suggesting that bearish sentiment continues to dominate the market. Additionally, the on-balance volume indicator is declining, reflecting continued selling pressure. While a bullish divergence on the relative strength index hints at a possible short-term rebound, the broader market trend remains downward.
Ethereum’s PECTRA Upgrade in 2025
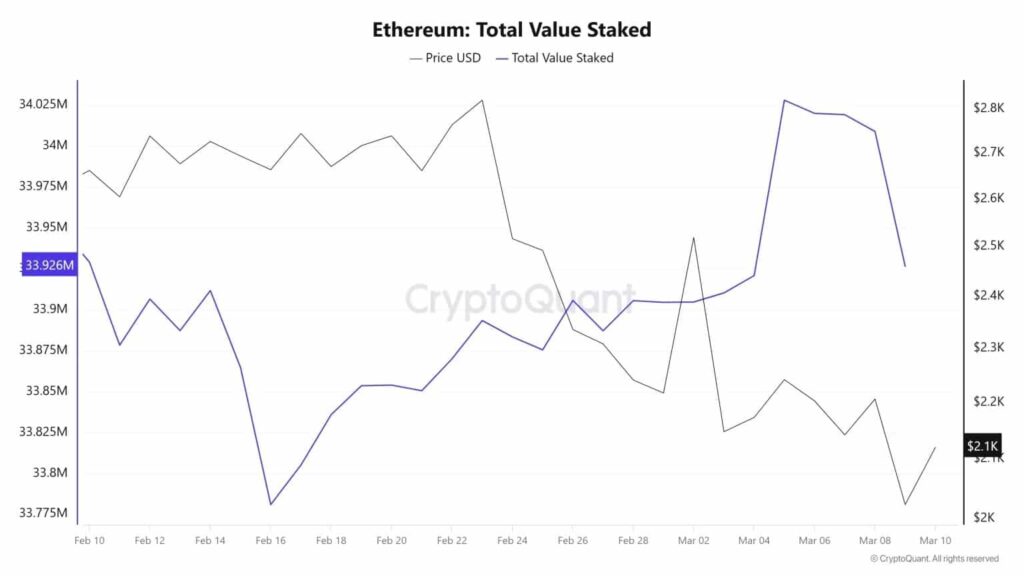
Despite ETHs current price struggles, its long-term fundamentals remain strong, with developers preparing for the PECTRA upgrade in 2025. This upgrade will merge the previously planned Prague and Electra updates, bringing scalability and performance enhancements to the network. Additionally, Ethereum 2.0 continues to progress, with total staked ETH currently standing at $33.926 million, according to CryptoQuant data. These upgrades could improve ETHs efficiency and attract more institutional adoption in the coming years.

Ethereum’s Potential Price Recovery
Although ETH is currently under pressure, some analysts believe it has the potential to rebound in the coming months. The first sign of recovery would be a successful breakout above $1,960, which could push ETH toward $2,200. If ETH maintains strength beyond this level, a rally toward $2,500 and above could follow. However, if ETH fails to hold above $1,750, there is a risk of further downside, with the possibility of dropping below $1,500 in an extended bearish scenario.
Long-term Ethereum Price Predictions
While short-term volatility remains high, analysts maintain an optimistic long-term outlook for ETH. Many expect ETH to surpass $5,000 in the coming years, fueled by rising adoption, growing institutional interest, and technological advancements. Some projections suggest that ETH could hit an all-time high of $5,925 if market conditions remain favorable. However, if bearish sentiment persists, ETH may struggle to gain momentum, delaying its path toward new highs.
Ethereum Price Forecast for 2028
Looking ahead to 2028, analysts expect ETH to solidify its dominance in the crypto market. In a best-case scenario, ETH could reach $10,410, reflecting growing use cases and adoption. If market conditions turn bearish, Ethereum’s price may decline to $8,613, with an average expected price of around $9,482.
| Month | Minimum Price | Average Price | Maximum Price | Potential ROI |
|---|---|---|---|---|
| January | $10,809.75 | $11,193 | $12,984.17 | 230.5% |
| February | $11,166.50 | $11,564 | $13,444.33 | 242.2% |
| March | $11,523.25 | $11,935 | $13,904.50 | 253.9% |
| April | $11,880 | $12,306 | $14,364.67 | 265.6% |
| May | $12,236.75 | $12,677 | $14,824.83 | 277.3% |
| June | $12,593.50 | $13,048 | $15,285 | 289% |
| July | $12,950.25 | $13,419 | $15,745.17 | 300.7% |
| August | $13,307 | $13,790 | $16,205.33 | 312.5% |
| September | $13,663.75 | $14,161 | $16,665.50 | 324.2% |
| October | $14,020.50 | $14,532 | $17,125.67 | 335.9% |
| November | $14,377.25 | $14,903 | $17,585.83 | 347.6% |
| December | $14,734 | $15,274 | $18,046 | 359.3% |
Ethereum Price Prediction for 2030
By 2030, ETH’s price is expected to reach new record highs, potentially climbing to $15,575. The price may drop to $12,647 in a bearish scenario, while the average projected price remains around $14,163. These predictions suggest that ETH could see substantial long-term growth despite short-term uncertainty.
| Month | Minimum Price | Average Price | Maximum Price | Potential ROI |
|---|---|---|---|---|
| January | $22,454.33 | $23,229.42 | $26,555 | 575.9% |
| February | $23,262.67 | $24,048.83 | $27,533 | 600.8% |
| March | $24,071 | $24,868.25 | $28,511 | 625.7% |
| April | $24,879.33 | $25,687.67 | $29,489 | 650.5% |
| May | $25,687.67 | $26,507.08 | $30,467 | 675.4% |
| June | $26,496 | $27,326.50 | $31,445 | 700.3% |
| July | $27,304.33 | $28,145.92 | $32,423 | 725.2% |
| August | $28,112.67 | $28,965.33 | $33,401 | 750.1% |
| September | $28,921 | $29,784.75 | $34,379 | 775% |
| October | $29,729.33 | $30,604.17 | $35,357 | 799.9% |
| November | $30,537.67 | $31,423.58 | $36,335 | 824.8% |
| December | $31,346 | $32,243 | $37,313 | 849.7% |
Conclusion
Ethereum’s recent drop below $2,000 has created uncertainty in the market, with investors closely monitoring price action. While technical indicators suggest continued bearish momentum, upcoming network upgrades and the possibility of an ETH ETF approval could provide a boost in the future. Whether ETH manages to regain key resistance levels or continues its downtrend will be determined in the coming weeks. For now, traders remain cautious, watching for signs of a confirmed reversal before making their next move.
The BIT Journal is available around the clock, providing you with updated information about the state of the crypto world. Follow us on Twitter and LinkedIn, and join our Telegram channel.
Frequently Asked Questions (FAQs)
1- Why has Ethereum dropped below $2,000?
Ethereum fell due to bearish market sentiment, increased selling pressure, and uncertainty around future trends.
2- Can Ethereum recover from its recent decline?
A breakout above key resistance at $1,960 could push ETH toward recovery, but strong resistance remains.
3- What impact will the PECTRA upgrade have on Ethereum?
The upgrade aims to improve scalability and network efficiency, potentially driving long-term adoption and growth.
4- What are Ethereum’s long-term price predictions?
Analysts predict ETH could surpass $5,000 by 2028 and reach as high as $15,575 by 2030 if adoption grows.
Appendix: Glossary of Key Terms
Spot Ethereum ETF – An exchange-traded fund that directly holds Ethereum, allowing investors to gain exposure to ETH without owning the asset.
Futures Liquidations – The forced closure of leveraged ETH positions when a trader’s margin balance falls below maintenance requirements.
Descending Trendline – A downward-sloping line connecting lower highs, used to identify resistance levels in a bearish trend.
On-Balance Volume (OBV) – A technical indicator that measures cumulative buying and selling pressure based on volume changes.
Relative Strength Index (RSI) – A momentum indicator that assesses whether an asset is overbought or oversold based on recent price movements.
Stochastic Oscillator – A technical indicator used to identify overbought or oversold conditions in an asset’s price trends.
PECTRA Upgrade – A planned Ethereum network upgrade in 2025 that combines the Prague and Electra updates to enhance scalability and performance.
References
FX Street – fxstreet.com
CoinPedia – coinpedia.org
Changelly – changelly.com
TradingView – tradingview.com
CryptoQuant – cryptoquant.com
CoinMarketCap – coinmarketcap.com


