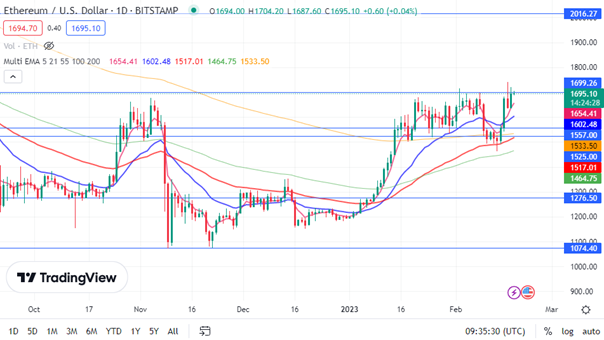
Ethereum, the second largest cryptocurrency in the market after the leading cryptocurrency, continues to move with Bitcoin. ETH, which has achieved an excellent exit by accompanying the purchases on the Bitcoin side, continues to push its resistance at the $ 1700 level. We can see from the graphs that Ethereum, which has been affected by the volatility in the market, has retreated a little and regained strength with the selling pressure experienced every time it has come to the resistance zone for the last few days. Ethereum, which started at the $ 1638 level yesterday, closed at $ 1694 with an increase of 3.43%.
At the time of writing, it is trading at $1695 with a daily increase of 0.04%.

Ethereum Chart Analysis
Ethereum, which has made great efforts to break the resistance at the $ 1700 level for the last few days, continues its persistent efforts. However, it has suffered some pullbacks with the intense selling pressure from this region. As we can see from the chart, the $1700 level can be followed as our first resistance point. I think closings above this resistance will accelerate the buying on the Ethereum side. In case of possible pullbacks, the daily levels of $1654, EMA5, and $1602, EMA21, can be followed as our first support points.

This article does not contain investment advice or recommendations. Every investment and trading move involves risk, and readers should conduct their own research when making a decision.
You might want to read this, too: Introduction To Dejitaru Shirudo Token: What You Need To Know


