Ethereum bullish breakout is long overdue after weeks of consolidation and presents newfound confidence in the market. The move, with powerful institutional flows and technical support alongside the growth of the DeFi, has its traders eyeing the $3,000 point.
Ethereum Bullish Breakout Gains Early Traction
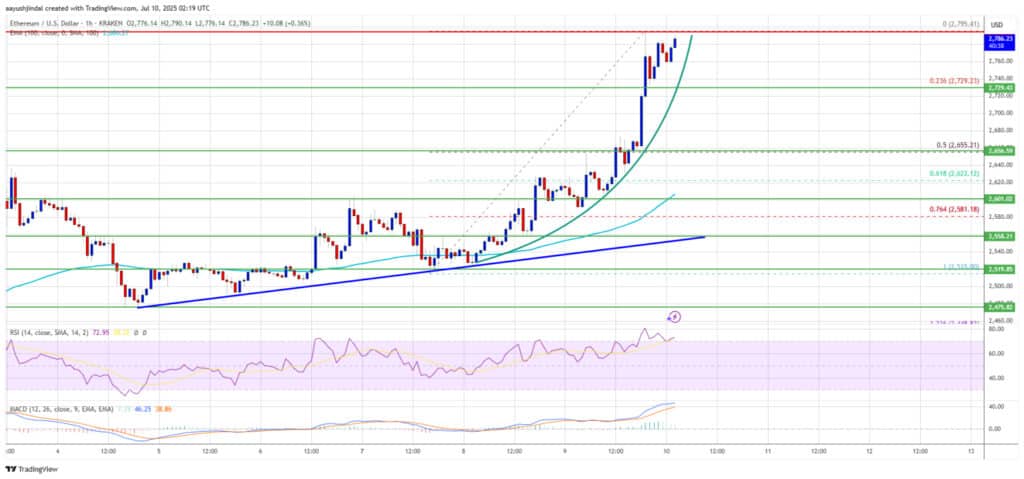
The Ethereum bullish breakout started as the price broke past the $2,650 mark. It was an important change of trend and led to subsequent profits. Ethereum broke the level of resistance over $2,720 and reached to the level of $2,800 and settled around $2,795.
Ethereum has gone higher than the 100-hour or simple moving average. There is also a parabolic curve pattern on the hourly ETH/USD, which also balances further gains that reveal that bullish momentum remains strong.
Ethereum Holds Above Key Support Levels
Even though there has been a quick ascent, Ethereum has been able to remain steady. It is trading at a price close to $2,720 accompanied by sturdy support at $2,750. Technical indicators supporting these zones are a 23.6% Fibonacci retracement of the move to decipher technical indicators of the low to high move of $2,516 to $2,796.
The first short position risk would only occur in case the price will turn down below the mark of $2,720, which may pull it back to the mark of either 2,650 or even 2,550. Nevertheless, buyers are dominant at the present moment.

Resistance Levels to Watch
Ethereum is experiencing a pushback above the $2,800 price mark. A sustained breach would take it up to the level of $2,840 and 2,880. Solid upside at $2,880 might be a clear extension of the Ethereum bull trend breakout, which could drive ETH futher to $2,910 shortly.
In case bulls have the momentum, price objectives might rise to $2,980, and even more, to the much-expected price target of $3,000. These areas have become the new market controls of the market players.
DeFi Growth Fuels Ethereum’s Strength
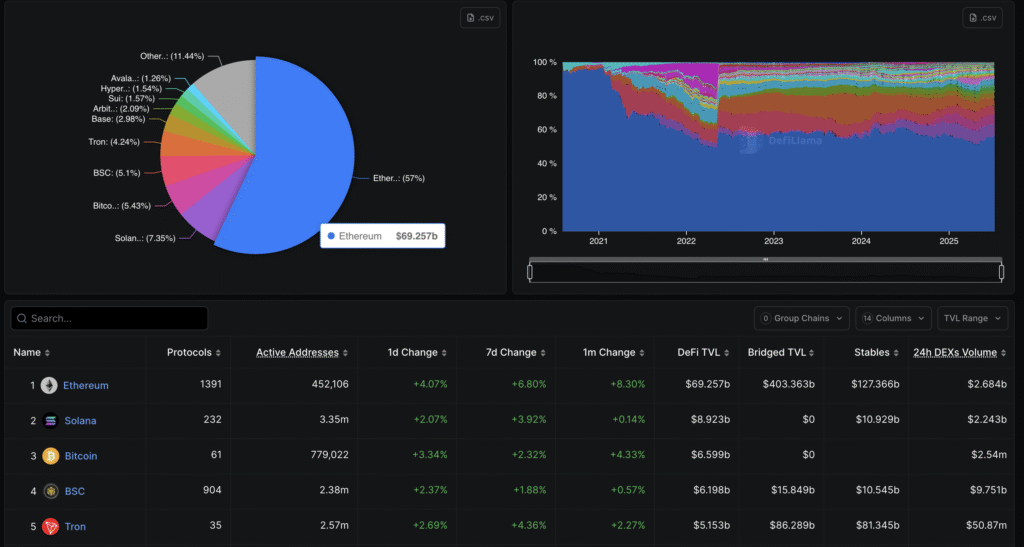
The wider decentralized-finance (DeFi) market is also significantly contributing to Ethereum growth. DeFiLlama showed that the total value locked (TVL) in DeFi protocols was at $121.41 billion. Ethereum takes the lion’s share as its market cap is currently $69.25 billion, rising up since April, which is $44.04 billion.

This $25 billion worth inflow of money into Ethereum favors the Ethereum bullish breakout, which is a clear indication of an increased need in ETH-based applications and services. It also indicates the confidence that the investor has on Ethereum as a hub of DeFi.

ETF Momentum Adds to Upside Pressure
The second staging ground that led towards the Ethereum bullish breakout is related to the high activity of ETFs. U.S. spot Ethereum ETFs collectively now have $11.84 billion worth of ETH as of July 9, according to SoSoValue.
Market analysts predict staking-related ETF products to see additional institutional inflows. The increasing ETF exposure is a long-term driver, and it continues to entice both retail and institutional consumers into Ethereum and ensure the break-out trend is maintained.
Derivatives Market Validates Bullish Sentiment
According to Coinglass data, Ethereum derivatives are heating. In the last 24 hours, the ETH futures volume increased by 64.85% to $97.56 billion. The open interest has also improved by 12.96% and stands at 40.93 billion. Such amplified trade demonstrates the trust of traders into the uptrend of Ethereum.
The open interest in options trading has also increased by 78%, which just affirms the high demand in ETH upside. Binance ETH/USDT top trader long/short ratio indicates good conviction of a major player, which is 2.599. The open-interest weighted funding rate is positive, indicating that there is no leverage depletion. There are still all indications confirming a still continued Ethereum bull run breakout.
Technical Indicators Remain Positive
Technically, Ethereum is trading through significant resistance and significantly above the important moving averages. The three EMAs (50, 100 and 200) are all pointing below the current price and can be considered good moments of support. The short-term chart parabolic H shape curve is still sending the price action into the upward trend.
Provided Ethereum succeeds in breaching the hurdles of $2,880 and $2,910 in the upcoming sessions, the second step of Ethereum bullish breakout may approach the $3,000 level by mid-July. Pullbacks are likely to happen in the short term, but the overall setup is bullish.
Conclusion
Such a strong signal of revival in the altcoin market is a bullish breakout of Ethereum. Ethereum is surging ahead of Bitcoin with the help of ETFs, DeFi expansion, and a significant increase in the use of derivatives. With the technical indicators remaining firm and the macroeconomic factors being in line, it appears that the $3,000 level is getting closer.
Summary
The Ethereum has broken into significant resistance levels, signaling a bullish breakout that preceded Bitcoin in early July 2025. With Ethereum inflows on the rise, combined with the prominence of the DeFi advancements and growth in derivatives trading, the asset is currently trading at more than 2,720.
The technical signs are still hawking the future move upwards, and investors will be targeting the 3,000 mark. The sudden energy in this Ethereum bullish breakout predicts that investor confidence and institutional interest will become stronger, and so Ethereum is the center location of the current crypto market optimism.
Frequently Asked Questions (FAQ)
1- What is driving the current Ethereum bullish breakout?
The breakout is driven by ETF inflows, DeFi growth, strong technical indicators, and increased institutional interest.
2- What resistance levels should traders watch?
Key resistance levels are $2,800, $2,840, $2,880, and $2,910. A move above these could push Ethereum toward $3,000.
3- Is the Ethereum bullish breakout sustainable?
Yes. As long as Ethereum stays above $2,720 and support at $2,650 holds, the breakout trend is expected to continue.
4- How are ETFs affecting Ethereum price?
Ethereum spot ETFs are attracting institutional capital, helping to increase demand and long-term price support.
Appendix: Glossary of Key Terms
Ethereum Bullish Breakout – A strong upward price movement in Ethereum that breaks past key resistance levels, signaling positive market sentiment.
Resistance Level – A specific price point where Ethereum tends to face selling pressure, making it difficult to move higher without strong momentum.
Support Level – A price zone where Ethereum finds consistent buying interest, often preventing the price from falling further during pullbacks.
Fibonacci Retracement – A technical analysis tool used to identify potential reversal levels during market corrections, based on key ratios.
Parabolic Curve Pattern – A steep upward curve on price charts that signals rapid price acceleration and strong bullish sentiment.
TVL (Total Value Locked) – The total dollar value of assets locked in DeFi protocols, reflecting the health and usage of the Ethereum network.
Open Interest – The total number of active derivatives contracts, such as futures or options, indicating market activity and trader commitment.
References
NewsBTC – newsbtc.com
FXStreet – fxstreet.com


