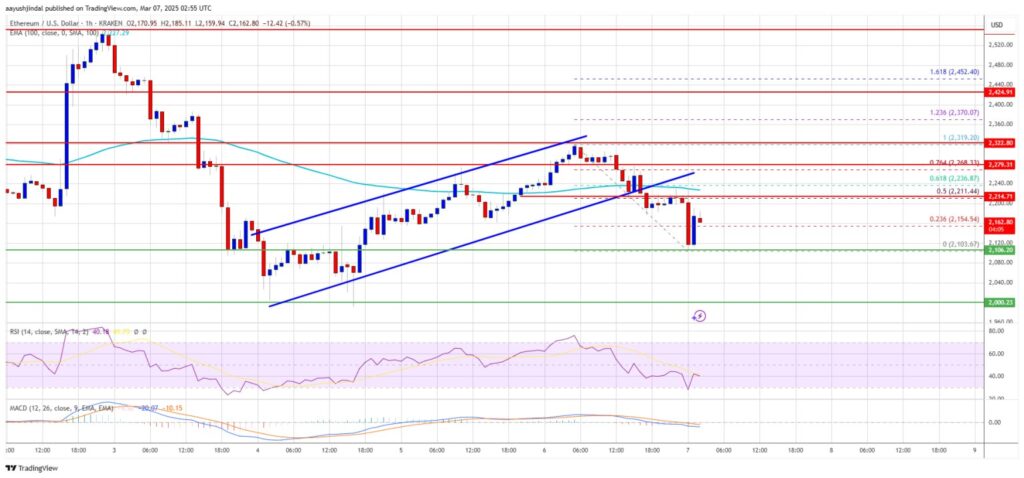
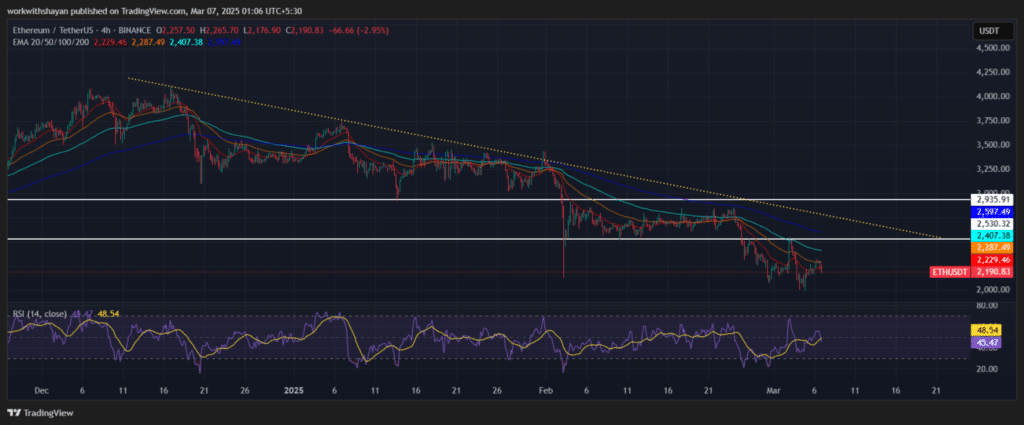
Ethereum has both sideways movements as well as fluctuations in the upward and downward inclination. ETH was able to go above the $2,000 which saw it cross the $2,120 and $2,200 levels. However, the price was rejected at the $2,320 and pulled back below $2,220 level.
Key Developments in Ethereum’s Price Action
The price of Ethereum elevated back up after it tested $2,103 level and it moved above $2,120 and even $2,150. Moreover, although the ETH price showing an increase to reach the upside but failed to test the important level of $2,220. The buying pressure is still not very strong as ETH is below the 100-hourly Simple Movings Average. Therefore for ETH to continue with this upward movement, a clear barrier is at $2,220 and seeks to target $2,275.
Support Levels and Potential Downside Risk
On the other hand, the upper level of criticality is placed at $2,100 for Ether. The next major sup-port zone, that lies below, is around $2,050. Nonetheless, if the price drops further, ETH can get as low as $2,000 or even completely plunge to $1,880. But if the price goes below these levels, even higher selling pressure is possible, the extra level is $1,740 considered to be the support level.
Whale Activity Impacting Ethereum’s Price Movement
Whale activity, particularly in Ethereum, has undergone a significant change as the price continues to fail to make substantial progress. Currently, IntoTheBlock shows that the number of transactions of whales is significantly low. The value has gone down to $5.5 billion from $11 billion in the case of large transactions which prove that the big fishes are not participating actively in the market. This trend could be interpreted as less conviction in Ethereum’s price trend since many of the whales may be less confident in ETH’s value in the short term.

Ethereum Whale Sentiment Shifts
CryptoQuant also revealed that ETH, especially holders with between 1,000-10,000 ETH coins, displayed a negative sentiment. These whales now have negative unrealized profits because of the changes in the price to the lower side. This change in sentiment among the large holders could put pressure on Ethereum’s price as most of them may be seeking to offload their stakes or cut down on their investments.
Market Sentiment and Liquidation Data
Market volatility has occurred with some liquidity, particularly in Ethereum. In the last 24-hour time period, around $47.87 million worth of ETH positions have been liquidated. In the liquidation side, the buyers were responsible for $28.1 million and the sellers realized $19.7 million worth of short positions. This implies that both the bulls and bears make changes to positions in detriment to the price movement of Ethereum thus contributing to the volatility of the market.
Such a pattern of trading and liquidation further shows how the ETH market behaves erratically. Since current prices are volatile, traders are often compelled to take immediate corrective action and either sell at the current price or cover the down side risk for a subsequent change in prices. Liquidations give signals of huge fluctuations and if the Ethereum fails to break through the critical level, it is likely to record more oscillation.
Ethereum’s Near-Term Price Outlook
Ethereum’s price is trading just below some significant barriers such as $2,220, $2,320 and $2,420. However, there is still some way to go before ETH can initiate the beginning of a rally of such significance; it must first push through these barriers while forcefully setting an upward trend. However, if ETH would be able to break the $2,320 area, it is quite possible that it could target the $2,500 or even $2,550 mark in the near future.

However, if the Ethereum price does not break this $2,220 barrier, the price might likely stagnate and may fell back to lower price range again. The immediate bearish levels include $2,100, $2,050, and $2,000. Failing to hold these levels, ETH price may decline to $1,880 support level.
Conclusion
Ethereum is trading at a crucial level making price movement highly relative to the levels that are both support and resistance levels in the coming days. However, the fight to reclaim the $2,220 level means that ethereum is likely to be in a consolidation zone at the moment. However, if ETH sustains and breaks through this level, there could be further upswing in the price from the current levels, otherwise another downturn is expected. Being the significant levels of movement, traders will focus on these levels as they try to predict the next Ethereum’s price direction.
The BIT Journal is available around the clock, providing you with updated information about the state of the crypto world. Follow us on Twitter and LinkedIn, and join our Telegram channel.
Frequently Asked Questions (FAQ)
1- What caused Ethereum’s price volatility recently?
Ethereum price swings have resulted from rejections at critical price points, such as $2,320 and unstable support benchmarks that create confusion among the investors.
2- How can Ethereum break the $2,220 barrier?
As for Ethereum, to break through $2,220, there must be higher buying pressure for this token and to extend the move above it towards $2,275.
3- What effect have whale activities had on the price of Ethereum?
The Whale transactions have reduced in size and shifted from positive to negative sentiment, posing possible drawing down pressures on the Ethereum price.
4- What are the key support levels for Ethereum?
The key levels of support for Ethereum are $2,100, $2,050, and $2,000, their breakdowns could lead to the continuation of the decline and $1,880 and $1,740 are the additional levels.
Appendix Glossary of Key Terms
EMA20: A 20-period EMA is another term that is used in technical analysis to filter price fluctuations in determining trends.
Fibonacci Retracement:A technique employed by the traders to fairly determine the levels, below or above which the prices are unlikely to move beyond in the future.
RSI: Relative Strength Index, having as a function an oscillator designed for digital and the change rate of price.
Liquidation: The automatic selling off of positions when the amount in a margin account drops to the required level.
Support level: It is the price level that is supposed to slow down an asset’s downward trend due to demand.
Resistance Level: A certain price level which has been resistant to further buying pressure and therefore is thought to deter buying while encouraging selling.
References
NewsBTC – newsbtc.com
CoinPedia- coinpedia.org
CrytpoQuant – cryptoquant.com
IntoTheBlock – intotheblock.com
CoinGlass – coinglass.com
CoinMarketCap – coinmarketcap.com
TradingView – tradingview.com


