Last night, Bitcoin briefly dipped below the $59,000 mark, yet the leading altcoin, Ethereum, managed to post a slight gain. This led to the formation of a doji candle. As Vitalik Buterin and the Ethereum foundations continue to sell ETH, the question remains: Will this glimmer of recovery hold? A seasoned analyst has pointed to a critical level for Ethereum, warning that breaching it could have serious consequences for the altcoin.
Analyst Highlights Ethereum’s Point of No Return
As reported by The Bit Journal, market sentiment in the crypto space is not very optimistic. Investors have yet to see the bullish momentum they hoped for in “Uptober.” Instead, warnings of further drops are surfacing. Crypto analyst Martinez has identified the crucial support level for Ethereum at around $2,250. According to his analysis, based on the TD Sequential indicator, Ethereum tends to experience strong bullish runs when its price climbs above the TD resistance trendline.
However, when ETH breaks below the TD support trendline, it typically undergoes an average correction of 53%. Currently, this support level sits at $2,250. Martinez stresses that falling below this level could trigger a significant correction. He shared his analysis again with the title, “Now we see why Vitalik Buterin and the Ethereum Foundation are selling,” emphasizing the increasing likelihood that Ethereum could dip below $2,250.

Ethereum Technical Analysis and Price Targets
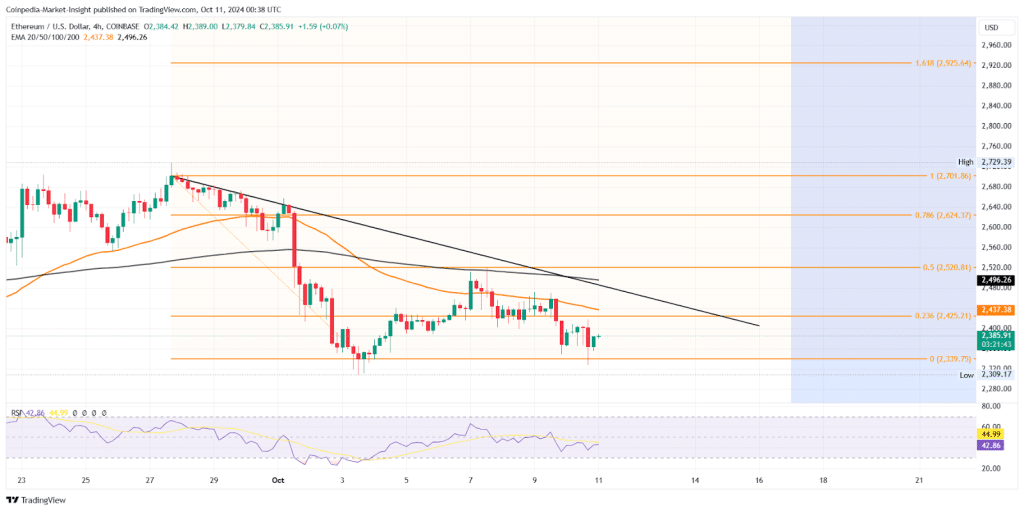
According to analysts, in the event of a bullish reversal, Ethereum could face key resistances at $2,425 and the local resistance trendline. Based on Fibonacci levels, a breakout rally could push Ethereum toward the 50% retracement level at $2,520 or the 78.6% retracement at $2,624. In a bearish scenario, support levels can be found at $2,300 and $2,200.
On the 4-hour chart, ETH’s price action shows a descending triangle pattern, with the altcoin testing the waters near the support trendline. There are hints of a bullish reversal, especially given the recent rejection near $2,300. Additionally, the RSI line on the 4-hour chart has shown bullish divergence between the last two dips near $2,340, indicating a possible double bottom formation.
Each time #Ethereum breaks above the TD setup resistance trendline 🔴, a strong bull run follows. But when $ETH breaks below the TD setup support trendline 🟢, we’ve seen an average 53% correction.
The key support now is $2,250—losing it could trigger a significant price drop. pic.twitter.com/PljkRda78S
— Ali (@ali_charts) October 10, 2024
- https://twitter.com/Thebitjournal_
- https://www.linkedin.com/company/the-bit-journal/
- https://t.me/thebitjournal
Follow us on Twitter and LinkedIn and join our Telegram channel to be instantly informed about breaking news!


