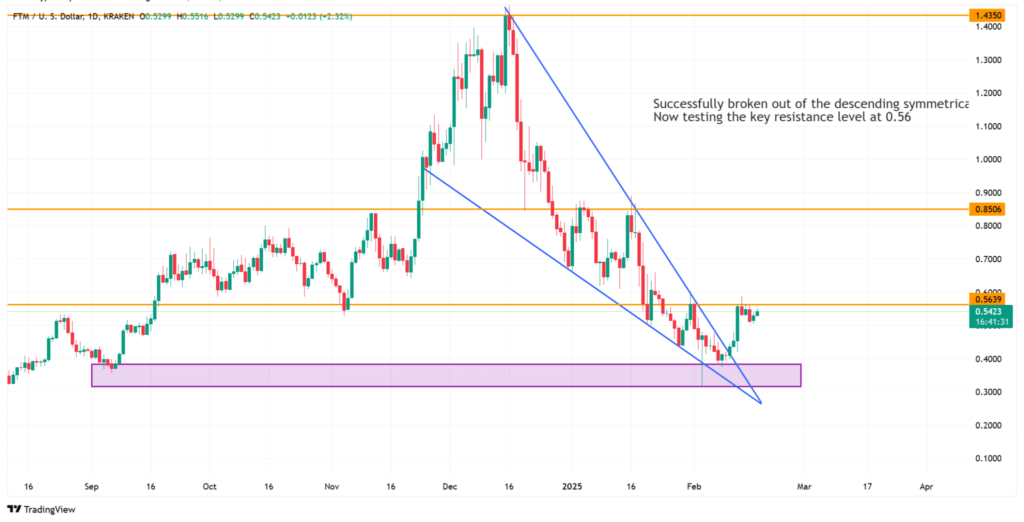
Fantom (FTM) has pulled out of the descending symmetrical triangle, which hints at the token’s bullishness. As of press time, FTM has increased by 9.11% and this increase is due to the high network usage and the rising number of profit holders, but this area may put pressure on the key levels and determine the next direction of the token. The next few days are crucial for Fantom to continue with an upward trend, or a downturn will occur.
Key Developments
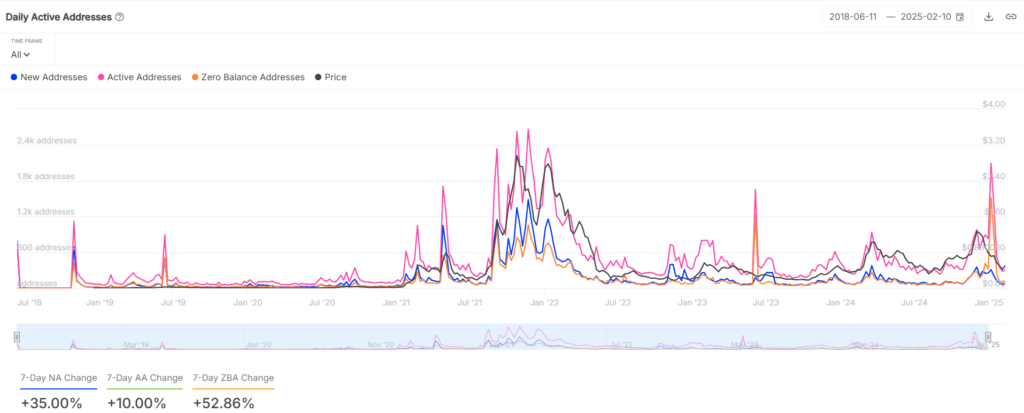
Fantom has now had quite good performance in recent days, specifically in price movements. This pattern also shows that after breaking out of the descending symmetrical triangle, there is an evident rise in the price of FTM. On-chain data analytics also indicates that the number of holders currently operating “in the green” has increased by 20.20%, which means more investors are profitable. New addresses continue to grow by 35% in the net seven days, thus proving that the network is gaining more users.
Overview
Fantom has recently given some signals that is has been bullish, as evidenced by an active network and technical aspects. The attempt to get out of the descending triangle looks rather optimistic in the perspective of an upward continuation, whereas the resistance levels may serve as a defeat in this case. The movement of the token will, therefore, depend on whether it can continue experiencing the current levels of growth or face a drop in prices.
At the moment, FTM is hovering around the $0.59 level, which is a make-it-or-break-it level for the token’s bullish run. The first level of technical resistance is $0.7420. If FTM can breach this level, it might move higher. If FTM is ready to rise above this level, the following significant barriers are $0.85 and $1.43.
Fantom Network Activity Surge
New addresses on Fantom’s network have shown impressive growth recently. The number of new addresses has risen by a 35% within a single week which indicates that there is growing adoption of the network. Although this is usually a favourable sign, it may mean that a growing number of people are spending time on the platform which may mean increased need for FTM.
Profit-Taking vs. Buying Demand
On chain data numbers also show that the holders categorized as “in the money” have rise by 20.20%. This implies more number of funds originated for the growth of technologies for mature into profitable market players FTM investors, indicating rosy market prospects. When more holders end up having a profit then they can feel that it is safe to buy and hold some more.
Nevertheless, the increase in profits may also lead to some amount of selling by investors seeking to lock in their gains. This is because profit-taking activities are met by continuous buying demand, hence the next direction of its movement will be a function of these two forces.
Profit-Taking and Selling Pressure
The rise in the number of zero-balance addresses, which rose by 52.86%, could be taken as evidence of some traders exiting or otherwise repositioning in Bitcoin. This can lead to the emergence of selling pressure that may put a halt to FTM’s growth rate. If the activity of profit- taking persisted, it can lead to the attainment of a pullback level in case new demand failed to take its place.
Mixed Transaction Data
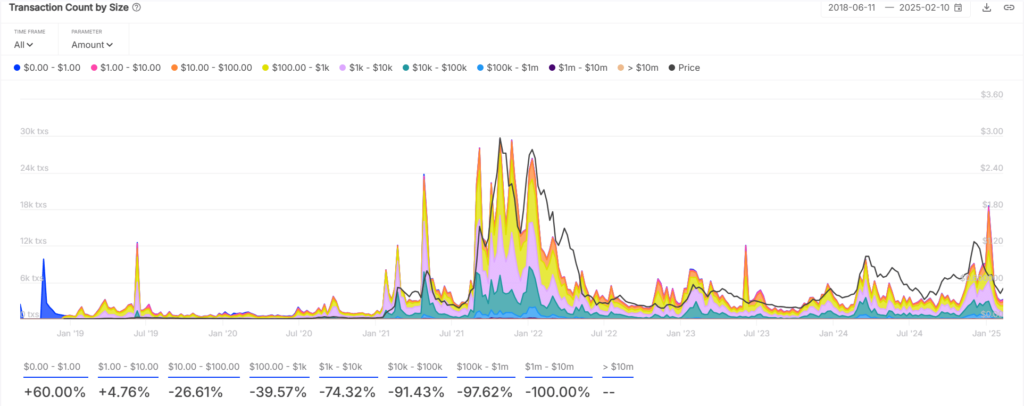
Fantom data indicates positive and negative transaction fluctuations based on the overall trend. Retail activity has been evident by way of the 60% rise in the number of transactions which are carried out for an amount less than $ 1. On the other hand, the moderately sized transactions between $10,000 and $100,000 have contracted signalling that the big players are less active now. Also noticeably, the transactions of values above $1 million have been eclipsed completely, which indicates that institutional investors are inactive.
Conclusion
Fantom has also appreciated the level of bullish pressure by starting to move out from the descending symmetrical triangle shaping pattern. The growth of the network activity and the growth of the number of holders with ‘in the money’ tokens can be regarded as a plus for the token. The following few days are sensitive for FTM as it will that can help the tokens sustain its bullish run or undergo a reversal. Two primary indicators will be important: the polarity of market sentiment and demand and a breakthrough over the vital level.
The BIT Journal is available around the clock, providing you with updated information about the state of the crypto world. Follow us on Twitter and LinkedIn, and join our Telegram channel.
Frequently Asked Questions (FAQ)
What does Fantom’s breakout signal?
Fantom’s breakout from the descending triangle indicates bullish momentum, but key resistance levels could impede further gains.
How is network growth affecting FTM’s demand?
A 35% increase in new addresses shows rising adoption, which could drive more demand for FTM tokens.
How could profit-taking affect FTM’s price movement?
Profit-taking might create selling pressure, potentially slowing down FTM’s price rise if buying demand doesn’t continue.
Why is the $0.59 level crucial for FTM’s future?
The $0.59 price point is a pivotal resistance; breaking it could pave the way for FTM to reach $0.85 and beyond.
Appendix: Glossary of Key Terms
Descending Symmetrical Triangle: A technical pattern indicating potential for either a breakout or a breakdown.
Whale Transactions: Large trades by institutional or wealthy investors that can significantly move the market.
Zero-Balance Addresses: Wallets with no funds, often signaling consolidation or exit from the market.
Profit-Taking: When investors sell assets to realize gains, which can lead to short-term price corrections.
Active Addresses: The number of unique wallets engaging in transactions on a network, a sign of network activity and adoption.
References
AMB CRYPTO – ambcrypto.com
TradinView – tradingview.com
IntoTheBlock – intotheblock.com


