The Kaspa price prediction now depends on its ability to break above the strong resistance zone around $0.118 to $0.120. This level has stopped Kaspa’s upward moves several times since late 2024. After a 13% jump, KAS has entered this zone again, giving hope to buyers but also making analysts cautious.
Even though buying activity is strong and momentum is up, early signs of selling pressure are showing again, raising doubts about how long the rally can last without a clear breakout.
Why is Kaspa’s resistance zone critical for its price movement?
Kaspa has hit a known resistance level between $0.114 and $0.127, which several sources have marked as a key supply zone. In both February and May, Kaspa tried to break above this price range but was quickly rejected, leading to noticeable drops shortly after.
The candlestick patterns show that the market is uncertain; buyers are making efforts to push the price higher, but red candles are starting to appear, signaling that selling pressure is building again.
CaptainAltcoin noted a recent red candle near $0.118, suggesting this price level is still acting as strong resistance. If Kaspa doesn’t get enough volume or momentum, it could face another rejection similar to what happened during past rallies.
Are market indicators suggesting a bullish or bearish trend?
Even though Kaspa is facing resistance, technical indicators still show signs of strength. Data from TradingView highlights a strong Accumulation/Distribution (A/D) trend, meaning buyers are still active in the market, this highlights possibility for bullish Kaspa price prediction.
In fact, over 10.18 billion KAS were accumulated, showing continued interest from investors. The Bull Bear Power (BBP) index has hit its highest level in two weeks, which points to growing bullish strength.
Still, experts are not all in agreement. CoinCodex notes that Kaspa’s RSI is at 77.94, which is an overbought level, meaning the price might be too high for now. They expect a short-term pullback if Kaspa can’t break above the current resistance zone.
| Level Type | Price |
| Support Zone 1 | 0.090 |
| Support Zone 2 | 0.070–0.075 |
| Resistance Zone 1 | 0.114–0.127 |
| Psychological Level | 0.120 |
What is happening with spot trading activity on Kaspa?
Spot trading data adds more complexity to the Kaspa price prediction. Taders on major exchanges sold over $1.48 million worth of KAS, even as the price moved higher.
This contrast between rising prices and continued selling suggests that short-term holders remain uncertain about whether the price will keep rising or fall again.
However, things may be changing. CoinGlass shows that selling has dropped sharply to just $47,000. This suggests that buyers might be coming back into the market.
If this buying continues and Kaspa holds above the resistance level, the bulls could start to take control again.
| Analysts | 2025 Bearish Target | 2025 Average Target | 2025 Bullish Target |
| Coincodex | $ 0.076836 | $ 0.076836 | $ 0.111806 |
| Changelly | $0.0819 | $0.114 | $0.0980 |
| Flitpay | $0.64 | $0.92 | $1.45 |
| Digital Coin Price | $0.0998 | $0.23 | $0.24 |
What does this mean for Kaspa’s price outlook in the coming weeks?
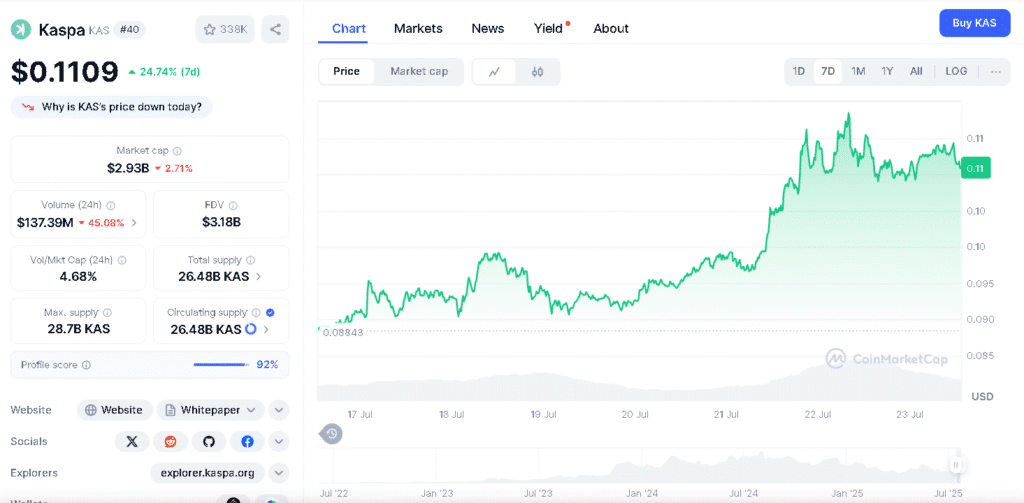
The Kaspa price prediction for the rest of July is uncertain. The price is still showing upward strength above the 9-day moving average of $0.0969, but the struggle near $0.118 suggests the rally might be slowing down.
CoinMarketCap’s analysis shows that the Bollinger Bands are tightening and trading volume is low, both signs that the market is uncertain.
Analysts warn that if Kaspa doesn’t break above the $0.120 level with strong support, the price could drop to around $0.098 or even $0.090.
Most major analysis platforms agree and advise traders to wait for clearer signals before making any big decisions.
Conclusion
Based on the latest research, the Kaspa price prediction is still uncertain. There are signs of growth, like strong buying activity and positive indicators, but the price continues to struggle at a key resistance level.
If Kaspa doesn’t break above $0.120 with strong trading volume, there’s a good chance the price could pull back.
If the buying continues and selling pressure fades, the price might aim for its 2024 highs. However, analysts advise being cautious as indicators suggest Kaspa is overbought.
Traders are advised to closey watch resistance levels and stay flexible with their strategies in case the trend changes.
Read this next, Kaspa price prediction, compare progress so far and see how trends shaped today’s resistance test.
Summary
Kaspa has surged 72% over the past month, but its price is now testing a key resistance zone. Analysts say this level has blocked previous rallies and may do so again without strong volume. While technical indicators show continued buying interest, others point to overbought conditions and possible short-term pullbacks.
Spot trading data also reflects mixed Kaspa price predictions. Until it breaks resistance convincingly, experts remain cautious about it.
FAQs
What is the current resistance zone for Kaspa?
The current resistance zone is $0.118 to $0.120.
What was Kaspa’s price surge over the past month?
It was approximately 72%.
Are Bollinger Bands indicating any trend shift?
Yes, they are narrowing, signaling possible consolidation.
What price level must Kaspa break for bullish Kaspa price prediction hopes?
A clear breakout above $0.120 with strong volume will aim for bullish Kaspa price prediction hopes.
Glossary
Bollinger Bands- A volatility indicator that helps spot price consolidation or breakout potential.
Bull Bear Power- An indicator showing the strength of buyers versus sellers in real time.
Spot Trading- Buying or selling crypto at current market prices, not through futures or options.
Red Candle- A price chart signal showing selling pressure in a given time frame.
Distribution- A phase where selling increases, often seen after a price rally.


