PEPE is a community-driven meme coin on Ethereum, with a total supply of 420 trillion tokens. Its value is rooted in social media engagement, meme power, and occasional speculative spikes. Unlike utility tokens, PEPE doesn’t have underlying product use, but it remains popular due to high liquidity and active trading culture.
Token movements by whales can have an outsized price impact, while the general crypto cycle tone also matters. Meme coins like PEPE are particularly sensitive to broader crypto sentiment, whale activity, and on-chain momentum.
June Technical Analysis for PEPE Price
Technicals are neutral to bearish going into June. The RSI is 33-54 , oscillating between oversold and neutral, showing weak momentum with room to bounce or break. The MACD is neutral to bearish, with mild downward bias but no momentum. PEPE broke below 99-day EMA (0.00001068) on June 17, short-term bearish; and daily lows found support is at 0.00000995-0.00000960.
Key PEPE price resistance is 0.00001048-0.00001056; critical support is 0.00000960-0.00000995, DCN analysis flags breakdown risk if broken. Sources note that a possible bullish MACD crossover, rising On-Balance Volume, and strong RSI/EMA alignment could signal upside potential if volume sustains.
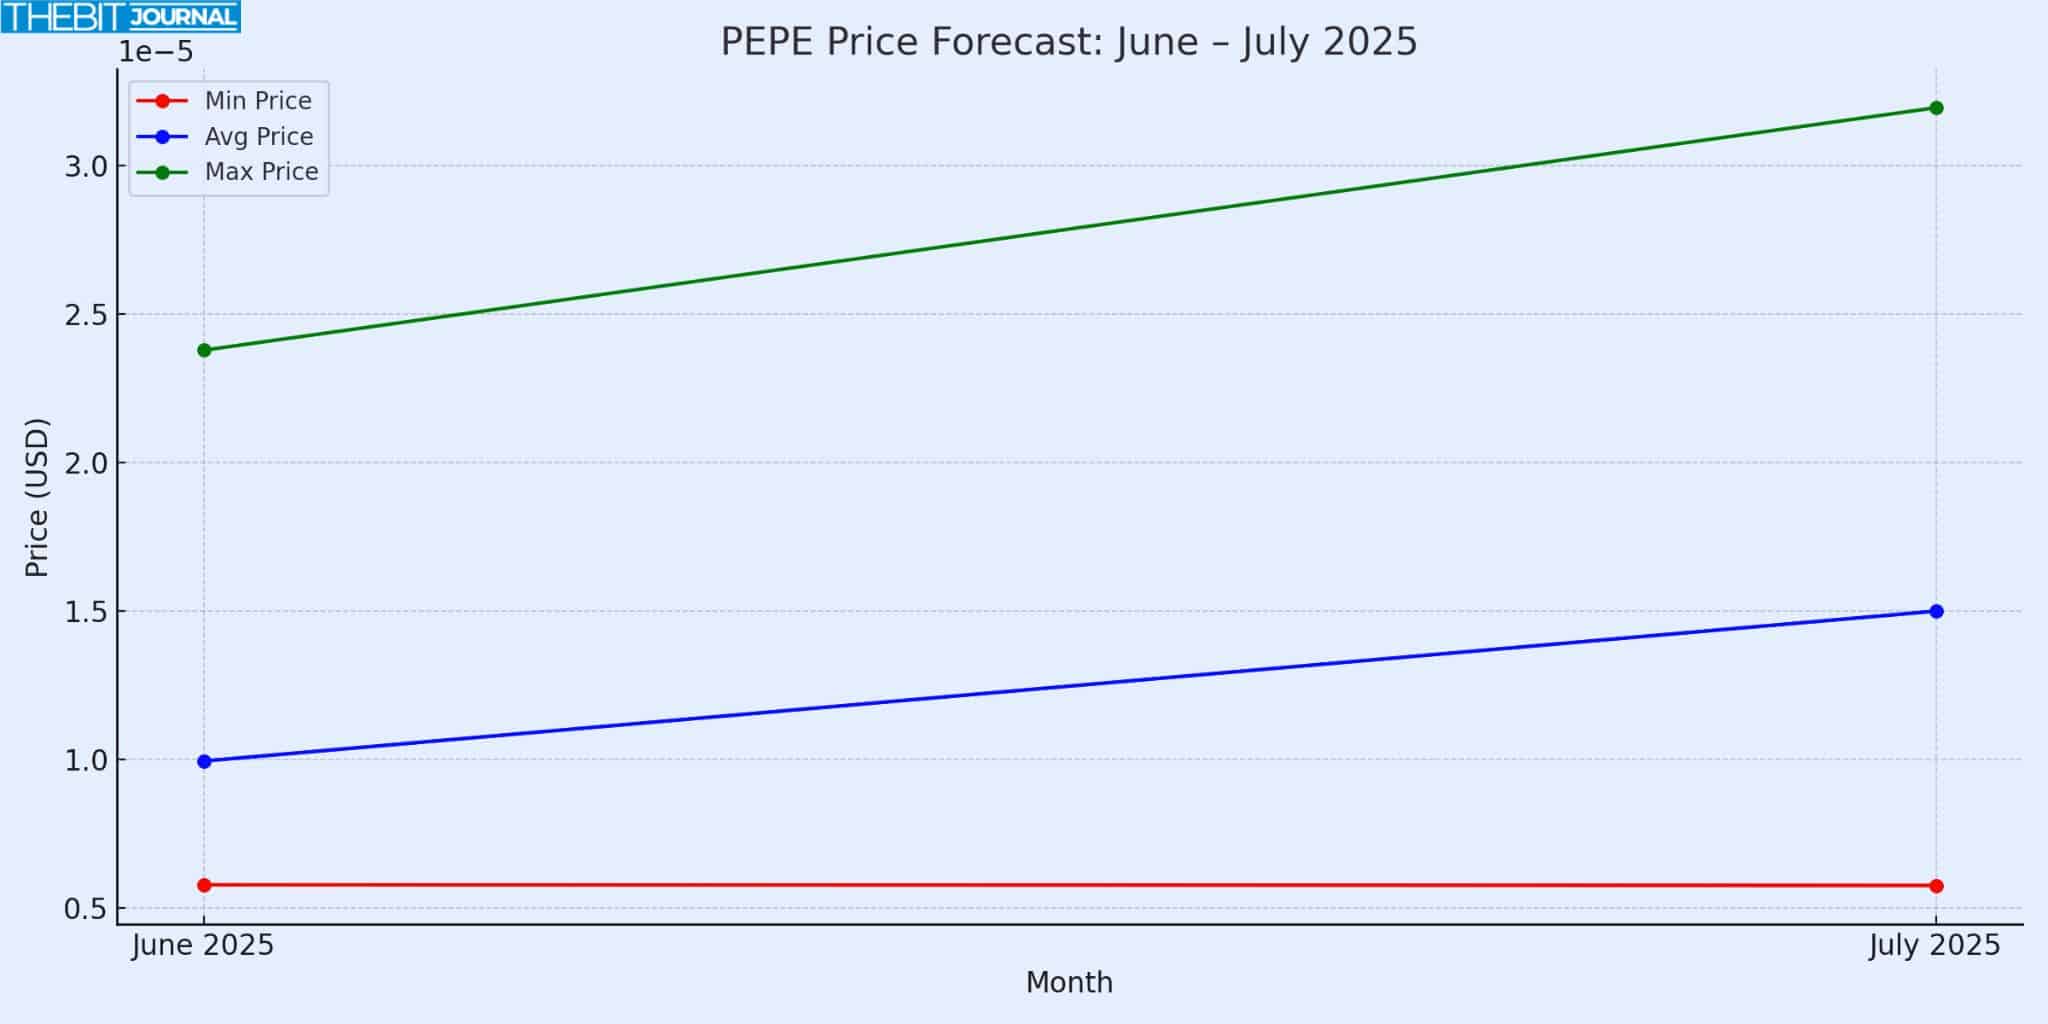
PEPE Price Forecast June–July 2025
Moving averages and RSI point to a critical early-June range of 0.00000960–0.00001056. If support holds, a bounce to 0.000012–0.000015 is possible as meme coin sentiment improves. If breaks below 0.00000960 occur, a deeper drop to 0.0000058 is likely.
- June Base Scenario: Range bound 0.000009–0.000012
- June Bear Case: 0.0000058 (if support fails)
- June Bull Case: 0.000020+ (if volume and sentiment surge)
Properly weighing bearish and bullish scenarios, for July, if June bounces, upward momentum could push avg near 0.000015, with an upside cap at 0.000032 if meme coin continues to rally. If June bears out, July will likely be flat at 0.000006–0.000010.
| Month | Min Price | Avg Price | Max Price |
| June 2025 | 0.00000578 | 0.00000995 | 0.00002379 |
| July 2025 | 0.00000576 | 0.00001500 | 0.00003196 |
Expert Forecasts
CoinCodex anticipates a bearish June, dropping 5% to 0.0000058, based on sentiment indicators and volatility trends. YouHodler, contrarily, projects a significant bullish move: June avg. 0.00002379 (range 0.00001974–0.00002803) and July avg. 0.00002868 (range up to 0.00003196), citing on-chain data and positive momentum trends.
3Commas/WalletInvestor offers a conservative base-case average of 0.0000099996 in 2025 for PEPE price, with narrow min/max bounds, which implies a flat outlook. Binance consensus expects modest long-term gains, targeting 0.000013 over five years, with 2026 around 0.00001.
Binance’s own technical summary in June warns of bearish range behavior, defining probable support/resistance levels and anticipating a limited breakout unless conditions change.
These PEPE price forecasts reflect diverging views, a clear indication of how speculative the crypto market is. Some see steep downside, others expect strong rebounds driven by on-chain flows and meme coin market recuperation.
| Source | June 2025 Forecast | July 2025 Forecast |
| CoinCodex | Expected June decline to 0.000005776 (–25%) | July expected around 0.000005763 |
| YouHodler | June predicted avg. 0.00002379 (range)160%) boost | July avg. 0.00002868 (high 0.00003196) |
| Binance Consensus | 5-year target of 0.000013 … 2026 around 0.00001 | Over multi-year horizon |
| Bin‑ance Technical Post | June short-term resistance 0.00001048, support 0.00000960–0.00000995 | – |
| 3Commas / WalletInvestor | 2025 avg. is 0.0000099996; min 0.0000096108, max 0.0000103884 | – |
PEPE Price Factors
Meme coin Market Mood: Bullish sentiment, often led by Bitcoin or Ethereum, lifts meme coins fast. Similarly, crypto downturns crush speculative assets like PEPE.
Whale Transfers: Significant token movements have occurred. Market reports note 11.75 trillion tokens moved by whales in late May, with one wallet shift of 27.9 million tokens; indicating accumulation or sell pressure that can sway prices appreciably
On-chain & Exchange Flow: More trading volume means more volatility. Binance reports June volume near $290M for PEPE, pointing towards lots of activity and potential for big moves.
Ethereum Gas Costs: As an ERC-20 token, PEPE is vulnerable to high gas fees. Lower fees means smaller trades that can amplify volatility, higher fees means less engagement.
Conclusion
June and July 2025 are important months for PEPE. Though technicals are neutral to bearish, but short-term signals could trigger a bounce. If support at 0.00000960–0.00000995 holds, a recovery is expected; if broken, a drop to 0.0000058 is likely.
Again, the expected base estimate include: June avg: 0.00000995, range 0.0000058–0.0000238 and July avg: 0.000015, range 0.00000576–0.00003196
Traders are advised to watch whale wallet activity, volume spikes and crypto-market momentum as meme coin cycles are unpredictable.
Follow us on Twitter and LinkedIn, and join our Telegram channel.
Glossary
RSI (Relative Strength Index): 14-day metric that shows overbought (>70) or oversold (<30) conditions.
MACD (Moving Average Convergence/Divergence): Trend following momentum indicator that shows the relationship; between two moving averages.
EMA (Exponential Moving Average): Type of moving average that gives more weight to recent prices; 99-day EMA used as resistance/support for PEPE.
Support / Resistance: Price zones where asset tends to stop falling (support) or rising (resistance).
On‑Balance Volume (OBV): Tracks volume flow to show buying or selling pressure.
Whale Activity: Large token transactions by major holders that can move the price.
FAQ
Why is PEPE so volatile?
PEPE has no fundamental use and is a meme coin. Large token pools and whale transfers amplify moves, making it very sensitive to market sentiment.
Can PEPE hit 0.00003 by July 2025?
In a bull scenario with strong volume and bullish indicators, yes, this is in line with the high-end of the YouHodler forecast. PEPE price would need a lot of positive drivers.
What would cause a PEPE price drop to 0.0000058?
Break of key support (0.00000960) and broad crypto downturn or whale sell-offs could trigger a drop according to bearish technicals.
Are these forecasts investment advice?
No. These are scenarios. Crypto trading is risky. Use risk management, do your own research and stay informed.


