Pepe’s price is currently facing a critical moment in its market structure after encountering local resistance. Despite the rejection, analysts point toward a possible higher low formation. This setup could lead to a strong upside move, provided technical and macro conditions align.
Pepe Price Tests Key Resistance Zone
Pepe’s price action shows rejection at the 0.618 Fibonacci level and value area high. The resistance zone does not signal bearish behavior, since it might serve as a launchpad for future upward movements. As Pepe’s price approaches this area, traders remain focused on whether it forms a higher low.
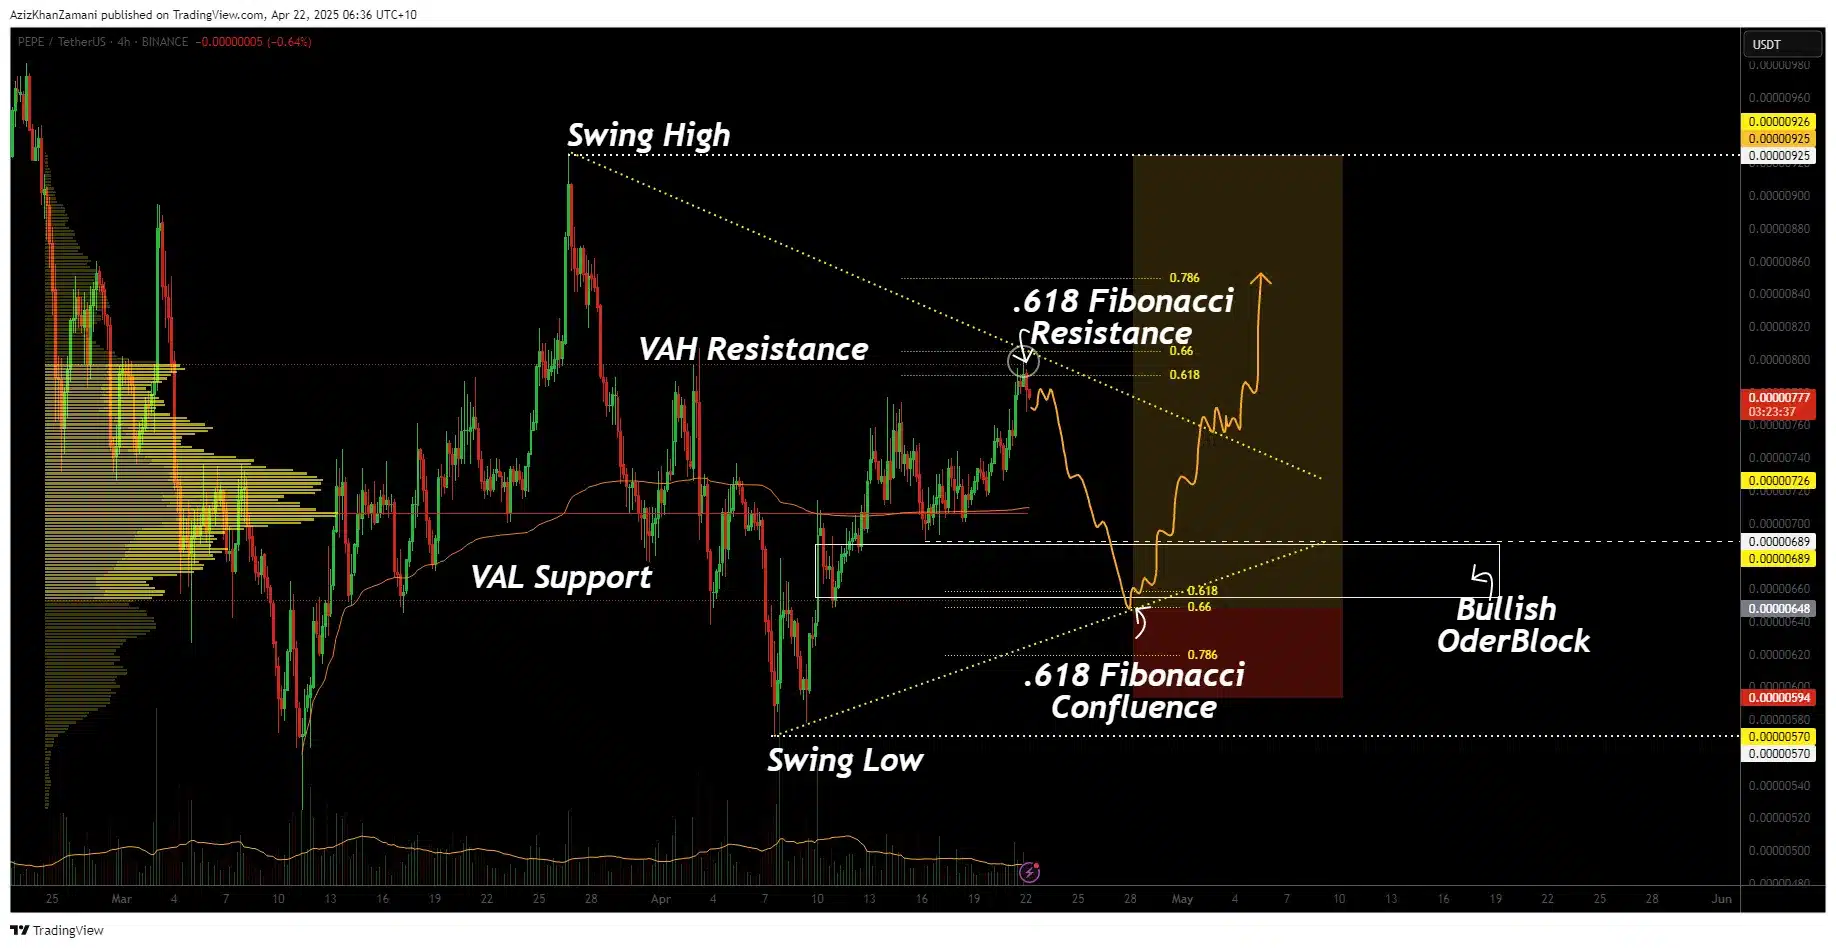
Market analysts interpret the intersection between the value area high and 0.618 Fibonacci levels as a powerful area of technical convergence. These levels correspond to the point of control where former volume concentration occurred and the 0.618 Fibonacci and value area high levels. A denial at this support region should trigger a temporary price decline before buyers resurge.
Pepe’s price could drop toward the VWAP and point of control levels, forming a healthy retrace pattern. Creating new swimming liquidity below the range establishes a suitable swing failure pattern. A strong bullish signal will be confirmed if Pepe’s price sweeps that low and recovers quickly.
Pepe Price Eyes Breakout After Higher Low
If Pepe’s price confirms a higher low, technical momentum may carry it toward the previous swing high. A clean recovery from support zones establishes the potential for an upswing, reaching 35% of the potential rally. An increase in Pepe’s price depends on steady market performance across cryptocurrencies, while Bitcoin maintains an upward direction.
Bitcoin and Ethereum remain key indicators for meme coin movement, including Pepe price performance. Should majors hold their uptrend, Pepe may see positive spillover effects. However, if Bitcoin corrects, Pepe’s price may invalidate the higher low structure.
Traders use the VWAP and point of control as indicators to identify potential defense strategies by buyers. The regions provide powerful crossover points and upcoming support areas. This confirmed rotation will create the necessary move-up forces to sustain an extended price increase.
Pepe Futures Open Interest Tops $200 Million
As of April 22, 2025, PEPE futures Open Interest (OI) has crossed $200 million, showing strong trader engagement. This surge in OI indicates a rise in speculative interest despite the Pepe price trading near lower support zones. Data from the past indicates that OI spikes tend to happen before major price fluctuations in the market.

The growing number of traders investing in PEPE futures contracts indicates their confidence that significant market volatility and potential price breakout events are imminent. Pepe price remains range-bound, but traders are positioning for directional movement. Traders typically display such speculative activities just before technical points of change occur.
Recent market sessions show bearish sentiment because the long/short ratio dropped below 1.00.

When the 0.85 ratio value appears, additional short positions are indicated. Market participants expect a short-term bearish price movement despite the positive fundamental analysis for the future.
FAQs
What is the current technical setup for the Pepe price?
Pepe price is testing a key resistance area but could form a higher low, signaling a bullish continuation setup.
What factors could support a 35% rally in the Pepe price?
A higher low followed by a breakout, strong VWAP support, and bullish Bitcoin momentum could support a 35% rally.
Why is Open Interest important for Pepe price analysis?
Rising OI indicates increasing trader participation, signaling upcoming volatility and stronger Pepe price movements.
How does the long/short ratio affect the PEPE price?
A lower long/short ratio shows bearish sentiment. If shorts are squeezed, the Pepe price could rally sharply.
Is Pepe’s bullish setup dependent on Bitcoin?
Yes, broader crypto sentiment and Bitcoin’s performance heavily influence meme coin trends, including Pepe price action.
Glossary of Key Terms
Fibonacci retracement: A technical tool identifying support and resistance levels based on price ratios.
VWAP (Volume Weighted Average Price): A trading benchmark showing average price adjusted for volume.
Point of Control: The price level with the highest traded volume within a given range.
Open Interest (OI): Total number of open futures contracts, showing market interest and liquidity.
Long/Short Ratio: A metric showing the number of long vs. short positions in the market.
Swing Failure Pattern (SFP): A market move where price sweeps previous lows or highs but quickly reverses direction.
Value Area High (VAH): The upper range boundary where most trading volume occurs.
Liquidity Sweep: A price movement that targets areas where many stop orders are placed.
Higher Low: A bullish pattern where the new low is higher than the previous one, indicating upward trend continuation.
Range-bound: A condition where price trades within a fixed high-low zone, showing indecision.
Reference:
