Bitcoin decline has caught the attention of veteran trader Peter Brandt, who has drawn parallels between the current market conditions and those that preceded the bitcoin 2016 bull run. Brandt’s analysis suggests that the patterns seen today echo the market movements that led to significant gains in the past, providing hope for investors during this turbulent time.

Similarities to the Bitcoin 2016 Bull Run
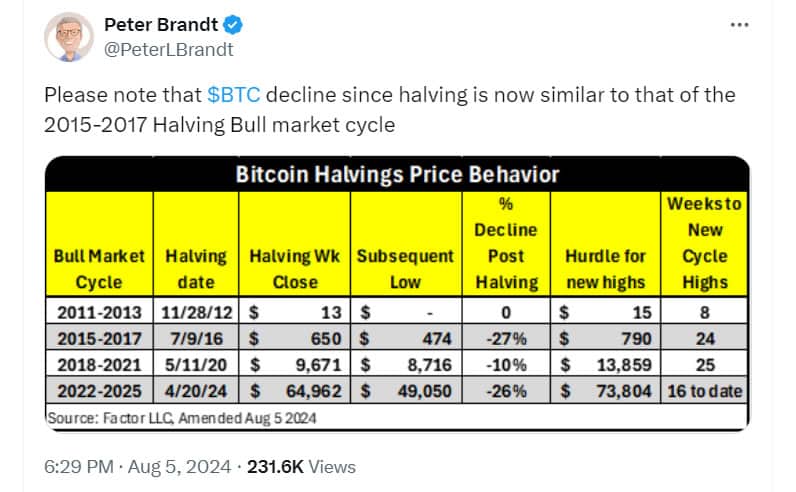
In an X post on August 5, Brandt noted that Bitcoin’s decline since the April 2024 halving mirrors the market corrections seen ahead of the bitcoin 2016 bull run. He stated, “BTC decline since halving is now similar to that of the 2015-2017 halving bull market cycle.” This observation is based on the depth of market corrections post-halving.
The 2016 Bitcoin halving occurred on July 9, when the price was $650. Following the halving, the market saw a 27% decline to $474 before beginning a meteoric rise to a peak of $20,000 in December 2017. Similarly, the recent Bitcoin slump below $50,000 represents a 26% decline from the post-halving price of $64,962.

Current Market Conditions
The recent decline has sparked concerns among analysts. On August 5, Bitcoin prices dropped significantly, reaching a low of $49,221, according to CoinGecko. This marks a 20% drop from the late July high of $70,000. However, there are signs of recovery, with Bitcoin bouncing back to $56,000 in early Asian trading on August 6, similar to patterns seen during the Bitcoin 2016 bull run.
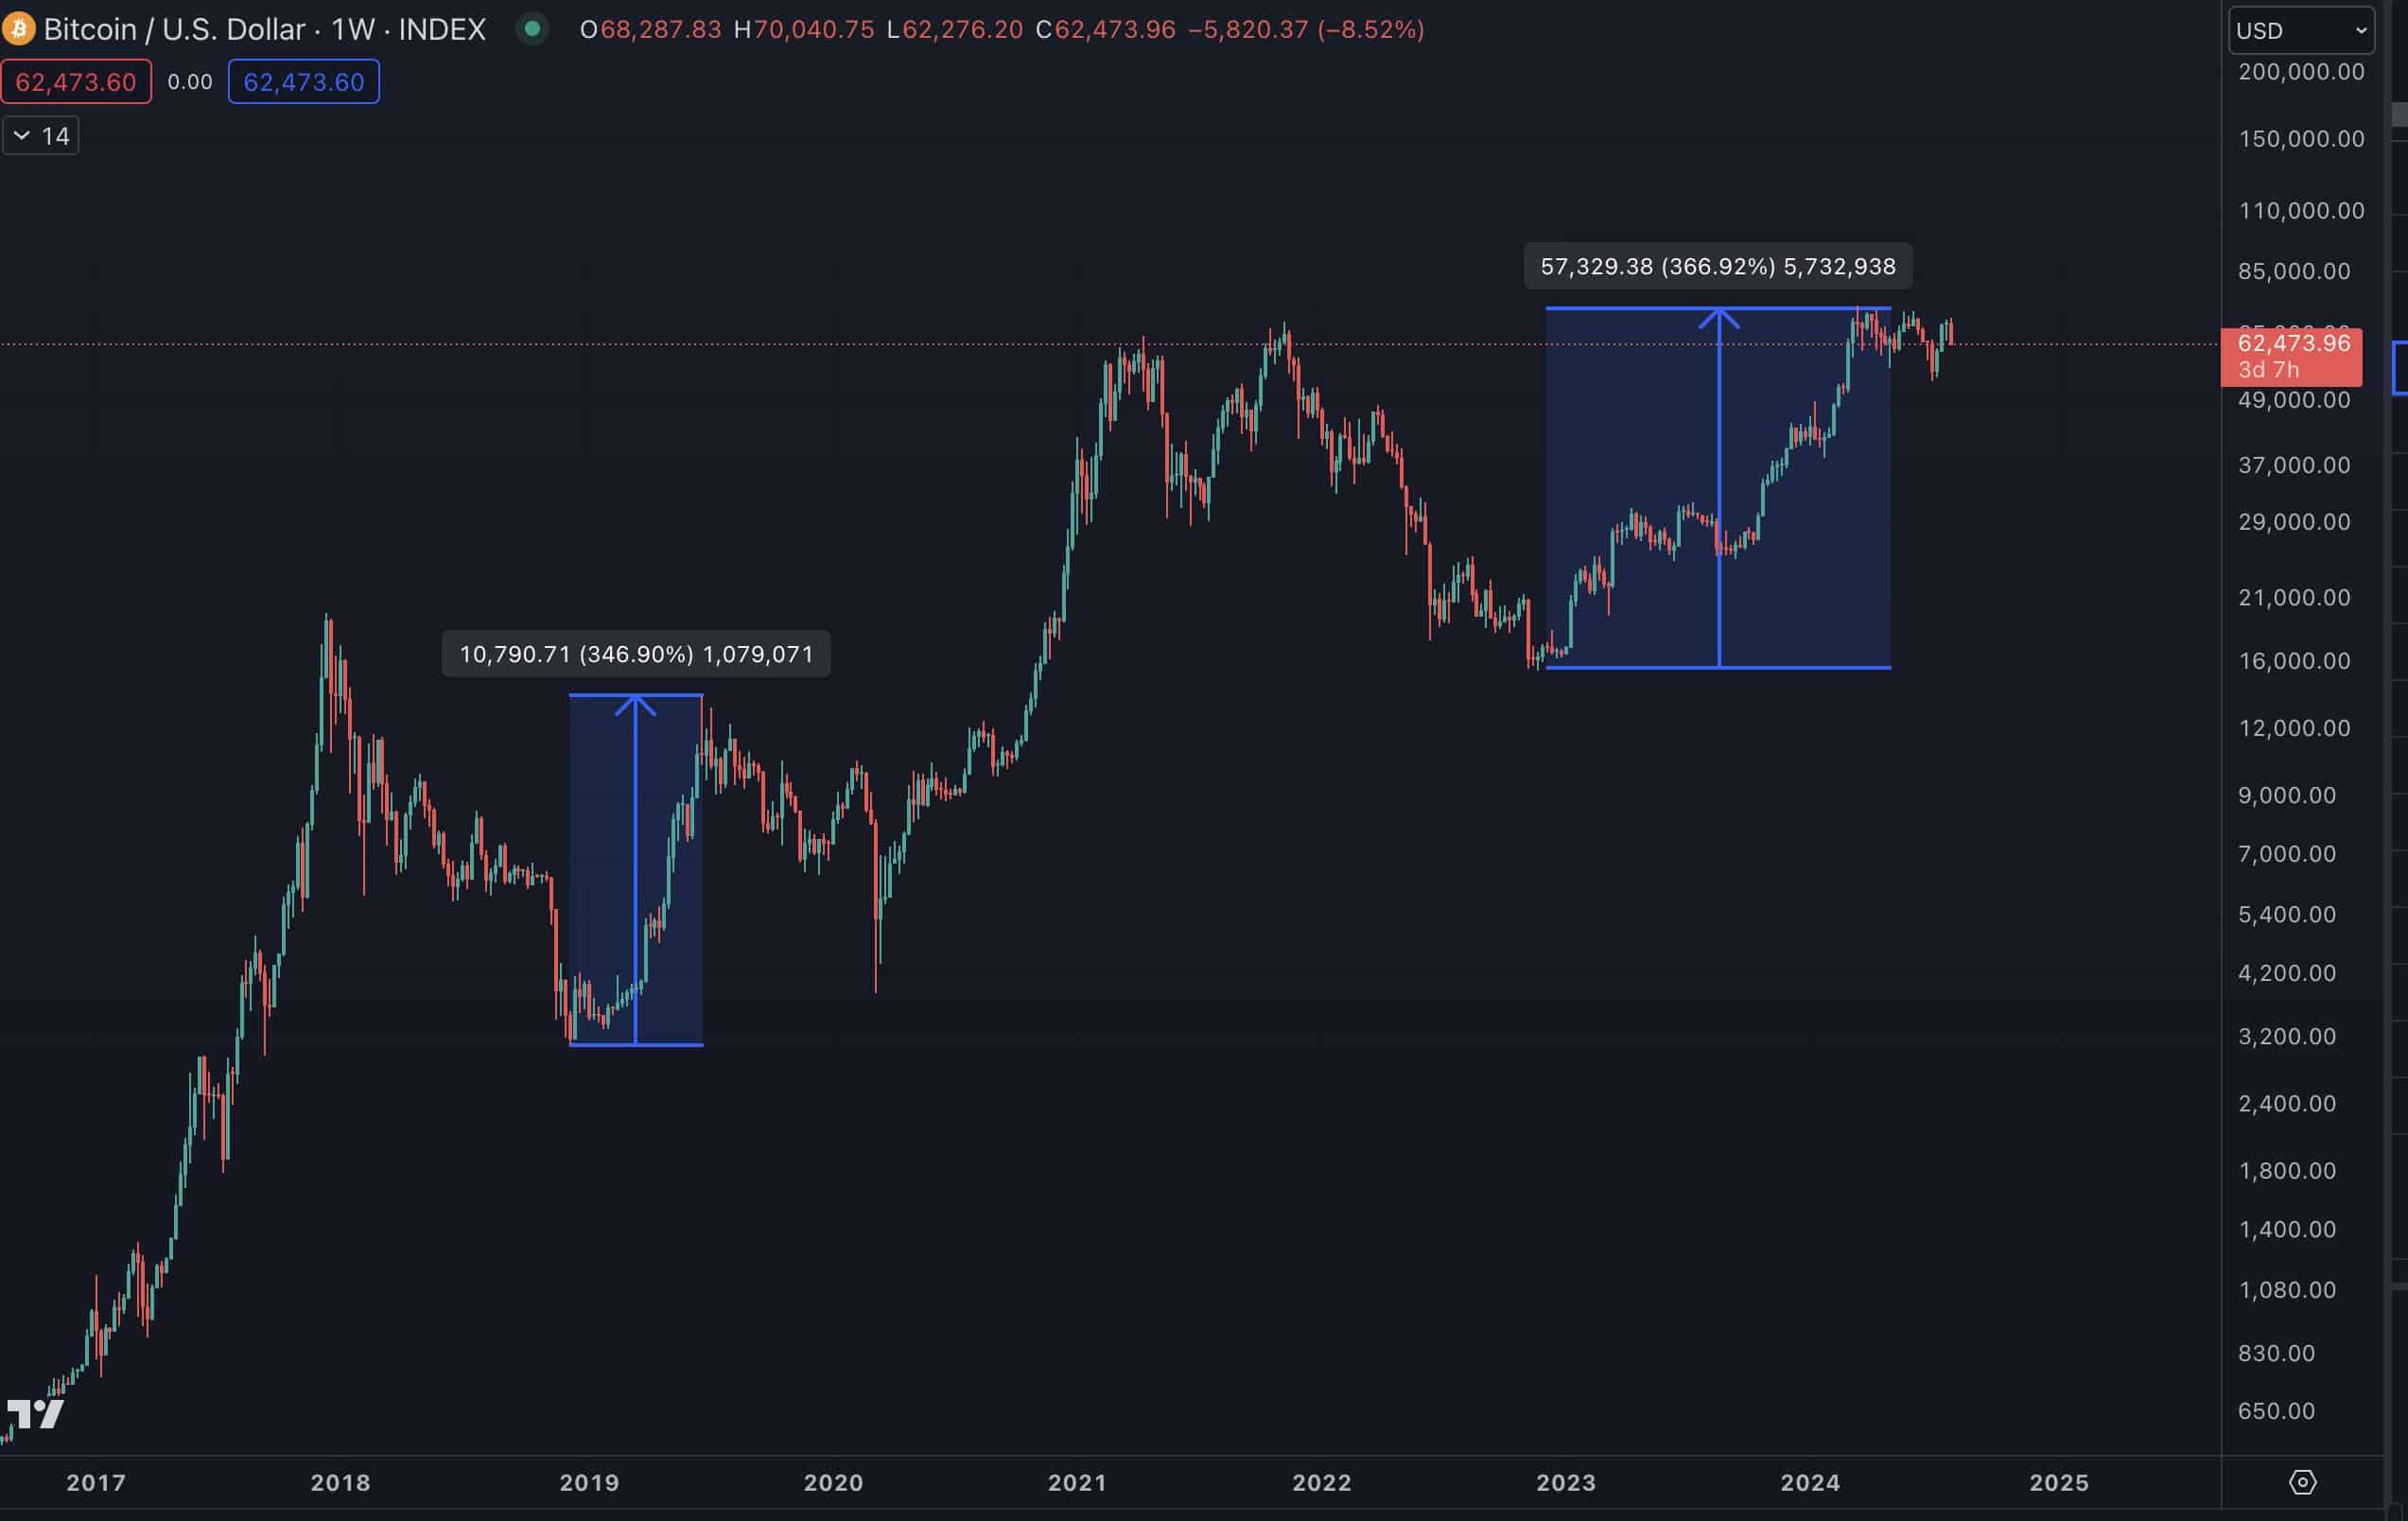
ITC Crypto founder Benjamin Cowen highlighted a similar pattern to that of 2019, where markets surged in the first half of the year before experiencing a substantial correction. According to Cowen, the recent movements may follow this historical trend, suggesting further volatility ahead.
Potential for Recovery
Despite the decline, there are optimistic signs for recovery. Tim Kravchunovsky, founder and CEO of the decentralized telecommunications network Chirp, emphasized that crypto assets could recover faster than traditional risk assets, similar to the post-pandemic recovery in 2020. He noted, “Macroeconomic factors are in the driving seat. Over the coming hours and days, we may well see a decoupling of crypto from traditional stocks.”
Historical data supports this view, as crypto markets have shown resilience and the ability to bounce back from significant drops. Brandt’s comparison to the Bitcoin 2016 bull run provides a historical precedent that could indicate a potential upturn in the near future.
Technical Analysis and Future Projections
Bitcoin (BTC)’s technical indicators also suggest a possible rebound. The Relative Strength Index (RSI) has rebounded from oversold levels to surpass the 50-midline, indicating that buyers may have the upper hand. Additionally, the Moving Average Convergence Divergence (MACD) shows a bullish crossover, with the blue MACD line climbing above the orange signal line, much like the period before the Bitcoin 2016 bull run.

These indicators point to bullish prospects, with investors potentially adding to their buying positions. If this buying momentum continues, Bitcoin could break above the current resistance levels, aiming for the $65,500 mark. However, it’s essential to note that Bitcoin still trades below both the 50-day and 200-day Simple Moving Averages (SMAs), suggesting potential for further declines if bearish trends prevail.
Conclusion
Peter Brandt’s analysis offers a hopeful perspective for Bitcoin investors, drawing parallels to the promising market conditions of the Bitcoin 2016 bull run. While the current market remains volatile, the historical context and technical indicators suggest potential for recovery. As always, investors should stay informed and consider market conditions when making investment decisions. For the latest updates and in-depth analysis on cryptocurrency markets, follow The BIT Journal


