Shiba Inu (SHIB), the renowned meme-based cryptocurrency, has recently captured the attention of investors and analysts alike. A confluence of technical patterns and on-chain metrics suggests that SHIB may be on the verge of a significant price movement.
Technical Analysis: Signs of a Bullish Breakout
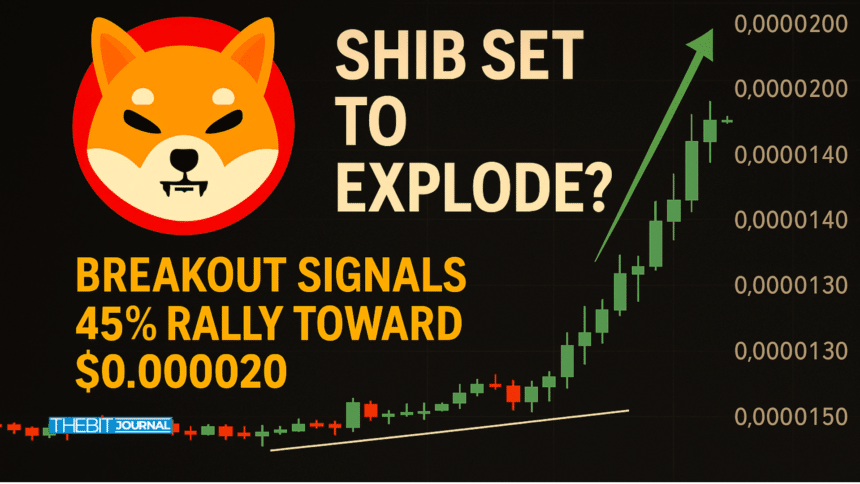
In recent trading sessions, Shiba Inu has successfully broken out from a descending trendline that had previously acted as a formidable resistance level. This breakout aligns with the formation of an inverted head and shoulders pattern on the daily chart, a classic bullish indicator. Such patterns often signal a potential reversal from a downtrend to an uptrend. Analysts posit that if SHIB’s price manages to close above the $0.0000138 threshold, it could pave the way for a rally toward the $0.000020 mark, representing a potential 45% surge.
However, it’s essential to note that despite these bullish signals, Shiba Inu remains below its 200-day Exponential Moving Average (EMA). The 200-day EMA is a critical indicator used by traders to assess the overall trend. Trading below this level suggests that SHIB is still in a broader downtrend. Nonetheless, the Relative Strength Index (RSI) for SHIB currently stands at 55, indicating moderate momentum with room for further upward movement.

SHIB Whale Activity: A Surge in Large Holder Inflows
Complementing the technical indicators is a notable surge in whale activity. Data from on-chain analytics firm IntoTheBlock reveals a staggering 2,025% increase in large holder inflows, with 6.26 trillion SHIB tokens flowing into whale addresses on March 20. Such significant inflows often suggest accumulation by major investors, potentially indicating a bullish outlook. Historically, whales tend to accumulate assets during periods of market corrections, anticipating future price appreciation.
Current Price Momentum and Market Sentiment
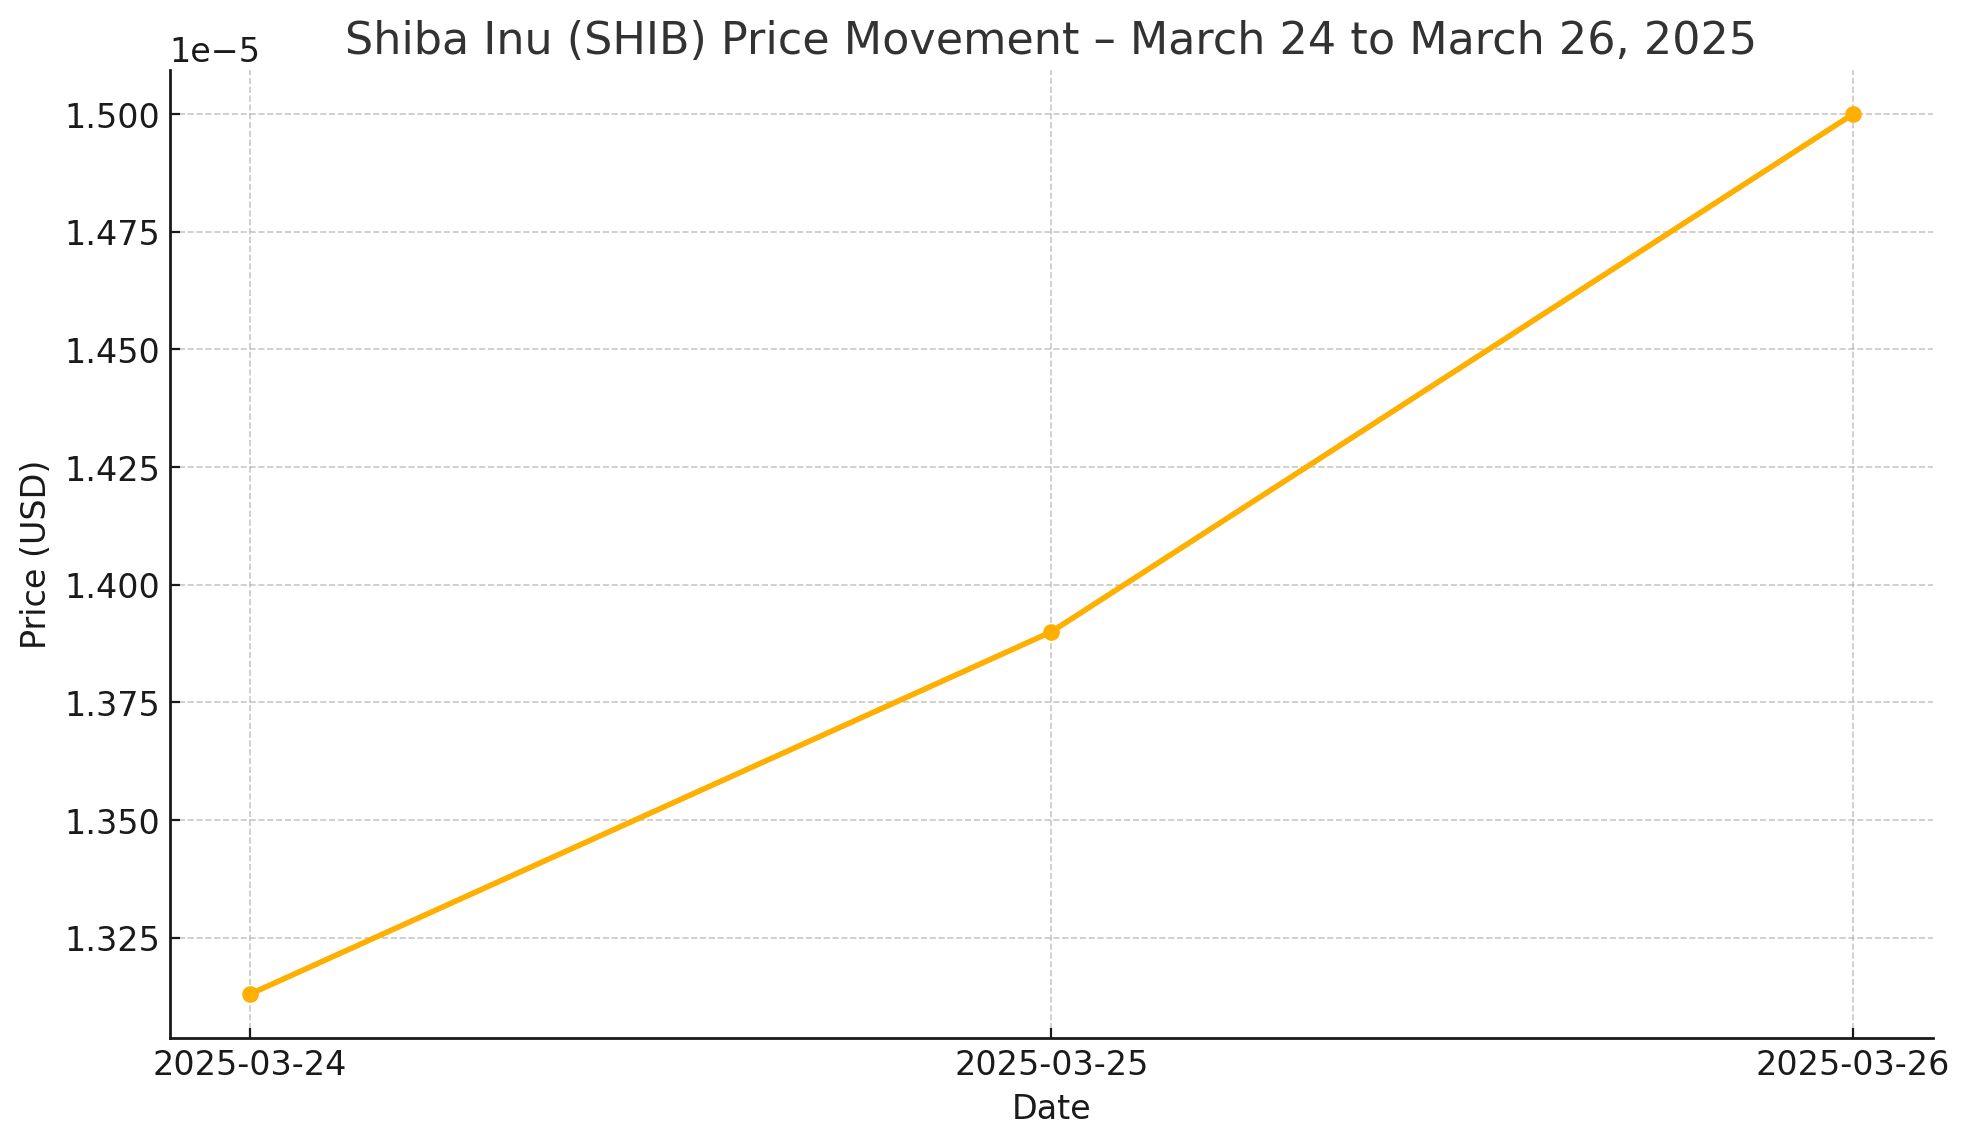
As of March 26, 2025, Shiba Inu is trading at approximately $0.000015, marking an 8% gain on the day and over 15% increase for the week. This upward trajectory is accompanied by a 228% surge in trading volume over the past 30 days, reflecting heightened interest and liquidity in the SHIB market.
The long-to-short ratio for Shiba Inu, currently at 1.08, further bolsters the bullish sentiment. A ratio above one indicates that more traders are betting on the asset’s price to rise, suggesting prevailing optimism among market participants.
Shiba Inu Price Table: Recent Performance Metrics
| Date | Price (USD) | Daily Change (%) | Weekly Change (%) | Trading Volume (24h) |
|---|---|---|---|---|
| March 24 | $0.00001313 | +2.5% | +5% | $500M |
| March 25 | $0.00001390 | +6% | +11% | $600M |
| March 26 | $0.00001500 | +8% | +15% | $750M |
Conclusion
Shiba Inu’s recent price action, characterized by a breakout from a descending trendline and the formation of a bullish inverted head and shoulders pattern, coupled with substantial whale accumulation, paints a promising picture for potential upward movement. However, investors should exercise caution, considering SHIB’s position below the 200-day EMA. As always, thorough research and risk assessment are paramount before making investment decisions in the volatile cryptocurrency market.
Frequently Asked Questions (FAQs)
What is an inverted head and shoulders pattern?
An inverted head and shoulders is a technical analysis pattern that indicates a potential reversal from a downtrend to an uptrend. It consists of three parts: a low (head) and two higher lows (shoulders). When the price breaks above the neckline connecting the two shoulders, it often signals a bullish trend reversal.
Why is the 200-day EMA significant?
The 200-day Exponential Moving Average (EMA) is a widely used indicator in technical analysis to assess the overall trend of an asset. Trading above the 200-day EMA suggests a bullish trend while trading below it indicates a bearish trend.
What does a surge in whale activity imply for Shiba Inu?
A significant increase in large holder inflows, or whale activity, suggests that major investors are accumulating SHIB. This behavior often indicates confidence in the asset’s future performance and can precede price increases.
How does trading volume impact price movement?
Higher trading volumes indicate increased interest and liquidity in an asset, which can lead to more significant price movements. Conversely, low trading volumes may result in price stagnation or increased volatility.
Is SHIB a good investment right now?
While recent technical indicators and whale activity suggest potential bullish momentum for Shiba Inu, it’s essential to conduct thorough research and consider market volatility before making investment decisions.
Glossary of Key Terms
Exponential Moving Average (EMA): A type of moving average that places greater weight on recent prices, making it more responsive to new information.
Relative Strength Index (RSI): A momentum oscillator that measures the speed and change of price movements on a scale of 0 to 100. An RSI above 70 indicates overbought conditions, while below 30 suggests oversold conditions.
Whale: A term used to describe individuals or entities that hold large amounts of a cryptocurrency, capable of influencing market movements.
Descending Trendline: A line drawn over the peaks of a price chart that slopes downward, indicating a bearish trend.
Long-to-Short Ratio: A metric that compares the number of long positions to short positions in a market. A ratio above one indicates more long positions, suggesting bullish sentiment.
Sources
Disclaimer:
The information provided in this article is for informational and educational purposes only and should not be considered financial advice. Cryptocurrency markets are highly volatile and speculative.


