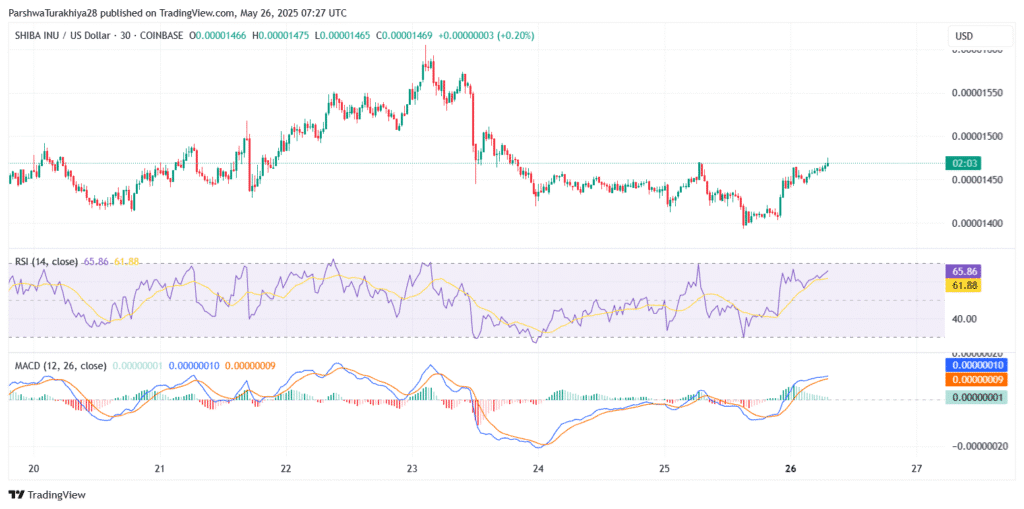
As of press time, Shiba Inu price is trading at around $0.00001447, showing modest bullish momentum. The token is getting close to key resistance levels after holding support near $0.00001408. Shiba Inu price is looking to climb to the middle of the pattern it formed in recent weeks.
Shiba Inu Price Action
The current price behavior of Shiba Inu price is affected by things happening in the market. The positive trend in the short term happened because of an upwards MACD crossover and buyers’ effort to protect the 50% Fibonacci retracement level after the fall last week. They tell us that there might be further increases in price.
Yet, with RSI and Stochastic RSI close to overvalued numbers, the rally might see consolidation unless support levels break first. Currently, Shiba Inu price action reflects a recovering bullish structure. The 4-hour and 30-minute charts show rising volume and a rebound off local support.
This indicates that Shiba Inu price has the potential for a sustained upward trend if it breaks through critical resistance zones. Traders closely monitor the price as it moves toward the $0.00001483 to $0.00001500 resistance cluster.

Fibonacci Levels and Key Resistance Zones
The price of Shiba Inu often shows important changes when these ratios are applied. After reaching the 50% Fibonacci level at $0.00001396, the token rose to hit the 38.2% level at $0.00001483. If Shiba Inu climbs above $0.00001483, the subsequent targets may be $0.00001592 and $0.00001760.
These levels will attract bullish traders in the upcoming days. The current price finds some support at both $0.00001309 and $0.00001380. If Shiba Inu is rejected at important resistance points, it may move back to these support points. So long as prices stay higher than their support, the bulls are in charge and a break upwards through the resistance zones is a possibility.

Indicators Suggest Potential Upside for Shiba Inu
Technical indicators point to a possible rise for Shiba Inu prices. Since the RSI is now close to 70, investors are likely feeling that prices are too high and beginning to buy. Even so, if the index moves much higher than 70, some traders might cash in on their gains and cause prices to drop again temporarily.
MACD just broke its recent downtrend as it crossed the signal line going up. Because trading volume is holding steady now, Shiba Inu may keep increasing. Price and the MACD are moving higher, both remaining under the $0.00001459 point in the middle of the Bollinger Bands. Should these patterns continue, we might see the prices move past the low area and get near the other zone.
Bollinger Bands and Ichimoku Cloud Analysis
On the 4-hour chart, Bollinger Bands are getting narrower, suggesting that the market is calm at that time. At present, Shiba Inu is encountering resistance at $0.00001459 which is exactly the location of the 50-day EMA.
If Price manages to break above this level for a prolonged period, the Bollinger Bands could expand further and support Price reaching $0.00001539. This result would be a powerful sign of a bullish breakout for Shiba Inu.

On the 30-minute chart, the Ichimoku Cloud shows Shiba Inu re-entering the cloud, with a flat Kijun line and a bullish Tenkan crossover. The resistance zone around $0.00001469 is crucial for the continuation of the upward movement. A close above this level would signal further bullish momentum, but failure to hold above could result in consolidation or a pullback.
| Technical Zone | Level | Significance |
| Immediate Support | $0.00001408 | Strong bounce zone |
| Secondary Support | $0.00001309 | 61.8% Fib + past accumulation |
| Short-Term Resistance | $0.00001483 | 38.2% Fib + EMA cluster |
| Breakout Trigger | $0.00001500 | Key level to flip structure |
| Bullish Target (if breakout) | $0.00001592 / $0.00001764 | Swing highs & fib extension |
Shiba Inu’s Short-Term and Long-Term Outlook
At present, Shiba Inu price fluctuates, as it examines important barriers. The coming 24 to 48 hours are crucial, as the market will tell us whether the token will keep rising or fall. Should bulls overcome $0.00001483–$0.00001500, Shiba Inu price could rise to $0.00001592 and even $0.00001760.
| Month | Min. Price | Avg. Price | Max. Price | Potential ROI |
|---|---|---|---|---|
| May 2025 | $ 0.0₅9280 | $ 0.00001227 | $ 0.00001487 | 2.54% |
| Jun 2025 | $ 0.0₅9707 | $ 0.00001163 | $ 0.00001343 | 7.40% |
| Jul 2025 | $ 0.0₅9086 | $ 0.00001152 | $ 0.00001331 | 8.24% |
| Aug 2025 | $ 0.0₅9417 | $ 0.0₅9833 | $ 0.00001187 | 18.17% |
| Sep 2025 | $ 0.00001093 | $ 0.00001217 | $ 0.00001345 | 7.23% |
| Oct 2025 | $ 0.0₅9639 | $ 0.00001058 | $ 0.00001123 | 22.55% |
| Nov 2025 | $ 0.00001065 | $ 0.00001142 | $ 0.00001434 | 1.09% |
| Dec 2025 | $ 0.00001705 | $ 0.00001867 | $ 0.00002101 | 44.86% |
If Shiba Inu price overcome the resistance near $0.00016 or a few cents higher, it could set up conditions for a strong upward move. If it breaks out above $0.00001500, the token could move higher, with levels above the $0.00001760 level still possible. The trend will be verified by traders reviewing both high trading levels and rising trends in the price chart.

Conclusion
It seems that Shiba Inu is about to overcome its main resistance in price. Even though most signs indicate a bull market, traders might notice that overbought RSI values cause the market to head sideways temporarily.
After crossing $0.00001483–$0.00001500, SHIB could rise further towards $0.00001592 and $0.00001760, since these will be new levels of resistance. Should all go well with these levels, a retreat is possible, so expect strong support at $0.00001309 and $0.00001380.
Frequently Asked Questions (FAQ)
1. What is the next resistance level for Shiba Inu?
The next challenge for Shiba Inu price lies around $0.00001483–$0.00001500. If climbing above this region happens, it could open the door to more gains.
2. What supports the Shiba Inu price bullish trend?
The MACD bullish crossover, rising volume, and the bounce off the 50% Fibonacci retracement level support the bullish trend.
3. Can Shiba Inu Price reach $0.00001592?
If Shiba Inu successfully breaks through $0.00001483, the next target is $0.00001592, with potential further gains.
4. What are key support levels for Shiba Inu?
Key support levels for Shiba Inu are at $0.00001309 and $0.00001380. These levels should be held to maintain a bullish structure.
Appendix: Glossary of Key Terms
Resistance Level: A price point where upward movement stalls due to selling pressure.
Fibonacci Retracement: A tool used to identify key levels of support and resistance based on mathematical ratios.
MACD: A momentum indicator that signals potential buy or sell opportunities through moving average crossovers.
RSI: A measure of price momentum that indicates if an asset is overbought or oversold. Bollinger Bands: A volatility indicator showing price range, used to predict potential breakouts or reversals. Ichimoku Cloud: An all-around charting tool that highlights trend movement and the areas a stock can rise or fall.
Bullish Crossover: Occurs when a shorter range moving average moves above a longer range one, suggesting things are going up.
References
CoinDesk – coindesk.com
CoinEdition – coinedition.com


