The Solana price continued to consolidate around $152.31, showing 3.37% gain over the past 24 hours. Analysts and traders remain divided in their outlook, with technical signals pointing in multiple directions. A breakout or breakdown appears increasingly likely as the tension builds across charts and order books.
Bearish Pattern vs Bullish Hopes
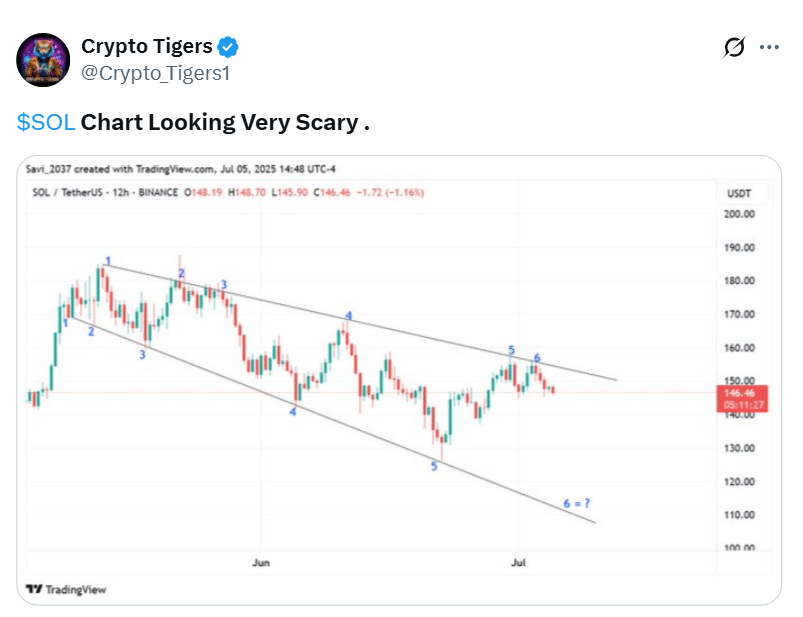
Technical analysts on social media flagged a descending broadening wedge on Solana’s 12-hour chart. This pattern, known for its volatility and unpredictability, is generally seen as a bearish setup if the lower trendline is broken.
According to this analysis, the Solana price could tumble toward the $120–$125 zone should the selling pressure increase in the coming days.
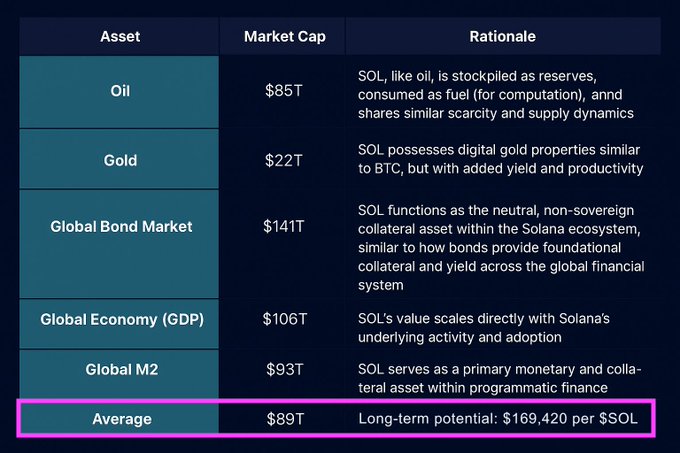
On the flip side, some market participants remain bullish. A widely circulated post projected long-term Solana price targets ranging from $169 to $420, citing growing institutional interest and network activity. However, this optimistic outlook contrasts sharply with near-term technical weakness.
Trading Volume Surges Sharply
According to CoinMarketCap, Solana’s 24-hour trading volume surged by 121.74%, signaling renewed trader activity. A sharp rise in volume often reflects growing anticipation of a major move, especially when the price consolidates in a tight range. The current Solana price action suggests that both bulls and bears are preparing for a potential breakout or breakdown.
| Month | Minimum Price | Average Price | Maximum Price | Potential ROI |
|---|---|---|---|---|
| July | $147.41 | $152.14 | $156.86 | 3.5% |
| August | $156.18 | $156.27 | $156.36 | 3.2% |
| September | $151.49 | $156.24 | $160.99 | 6.3% |
| October | $152.74 | $158.86 | $164.98 | 8.9% |
| November | $152.87 | $158.03 | $163.18 | 7.7% |
| December | $157.66 | $159.80 | $161.94 | 6.9% |
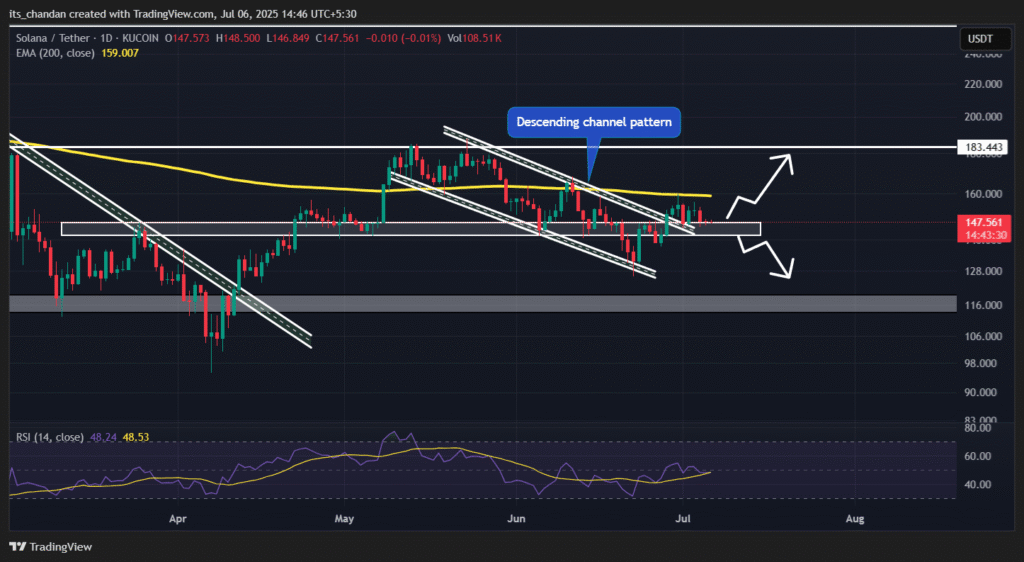
The descending broadening wedge identified on the chart is a critical factor in the short-term outlook for Solana. This pattern is characterized by widening price swings within downward-sloping trendlines.
If Solana price breaks below the lower boundary of the wedge—currently near $141—analysts warn that a rapid decline toward $125 or even $120 is likely. The pattern’s historical reliability as a bearish signal is raising concern among short-term traders.
Support and Resistance Define the Battlefield
Solana price is currently testing key support levels between $145 and $141. A successful defense of this zone could keep prices stable, at least temporarily. However, failure to hold could invite deeper losses. On the resistance side, a break above $160 would signal renewed bullish momentum and possibly send Solana toward the $183 level. Until then, the range between $140 and $160 remains the critical zone to monitor for the next move.
Exchange Inflows Suggest Caution Among Investors
Data from on-chain revealed that exchanges recorded $4.26 million worth of SOL inflows in the past 24 hours. While this could indicate a shift in trading strategies, it often signals that holders are preparing to sell.
Historically, such inflows correlate with upcoming price declines as investors move assets onto exchanges to reduce risk or capture gains. This cautious positioning adds another layer of pressure to the already fragile Solana price structure.
Recent derivatives data further confirms the growing bearish sentiment. At press time, short positions on Solana reached $78.42 million, far surpassing the $53.97 million in long positions.

Traders appear to be leveraging heavily around the $145.1 support and $149.5 resistance zones. The skewed positioning highlights a growing belief that the Solana price may break lower in the short term unless sentiment quickly reverses.
Solana Price Trend Direction Weakens Despite Temporary Breakout
A recent X post by analyst CoinCodeCap showed that despite a brief breakout from a descending channel, Solana remains in a broader downtrend. The short-term, medium-term, and long-term trend indicators are all tilted bearish. Momentum has also weakened, as shown by a declining MACD.
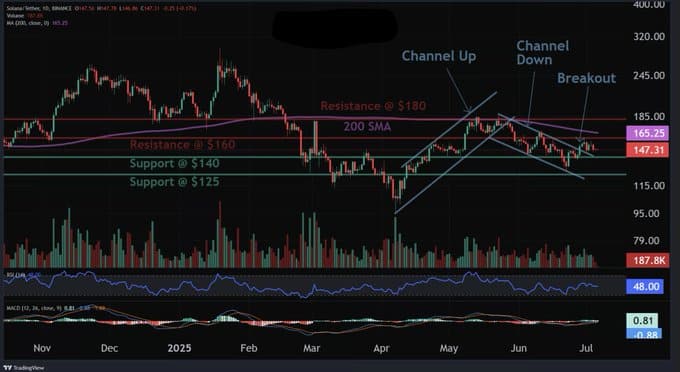
While some short-term setups suggest a possible bounce to the $160–$167 zone, analysts caution that this would be a high-risk, counter-trend move. Analyst advises a stop-loss at $136 for traders attempting to catch a rebound.
Conclusion
The Solana price remains stagnant near $152, caught between opposing forces and declining market participation. Technical patterns suggest a potential breakdown, while a subset of traders remains bullish. With volume falling, short interest rising, and chart signals flashing red, the pressure is mounting.
Until a clear breakout above $160 or below $141 occurs, the market is likely to remain choppy and uncertain. Traders are advised to proceed with caution and closely monitor support and resistance zones, as the next move could come swiftly and with high volatility.
Summary
Solana price hovered near $152.31 with a 3.37% gain, but uncertainty remains high. Analysts are split, with some predicting a drop to $120–$125 due to a descending broadening wedge, while others see potential upside to $420. A 121.74% surge in trading volume signals rising anticipation.
Solana now sits between key support at $141 and resistance at $160. With short positions increasing and momentum weakening, traders are on edge, awaiting a decisive breakout or breakdown to set the next trend.
Frequently Asked Questions (FAQ)
1- Why is Solana price facing pressure?
Solana price is under pressure due to a descending wedge pattern, low volume, rising short positions, and resistance at key levels.
2- Could Solana price rise in the short term?
A break above $160 could trigger a short-term rally, with potential upside to $183. However, momentum remains weak.
3- What are the key levels to watch for Solana?
Support lies at $141 and $125, while resistance zones are set around $160 and $180.
Appendix: Glossary of Key Terms
Solana Price – The current market value of one SOL token, influenced by supply, demand, and market sentiment.
Descending Broadening Wedge – A technical chart pattern marked by diverging trendlines; often signals increased volatility and potential breakdowns.
Support Level – A price zone where buying pressure tends to prevent further declines.
Resistance Level – A price point where selling pressure commonly halts upward movement.
Trading Volume – The total number of tokens traded within a specific period; indicates market activity and interest.
MACD (Moving Average Convergence Divergence) – A momentum indicator used to identify trend direction and strength.
Short Position – A bearish bet that the asset’s price will decline, often placed using leverage.
Reference
AMB Crypto – ambcrypto.com


