According to recent market data, Solana (SOL) continues to face strong selling pressure, pushing its price lower. Since its peak price above $250, Solana has experienced substantial price devaluation to its current value. The market exhibits high volatility, suggesting prices will likely keep dropping in the near future.
The forthcoming release of 11.2 million SOL through FTX’s bankruptcy will intensify market selling activity. In March, the supply volume of $1.6 billion SOL will become accessible, raising questions about the token’s stability. Market pricing may decline further during the upcoming weeks because demand fails to match this additional supply.
Market investors display persistent doubt because of independent crypto frauds like $LIBRA, $TRUMP and $MELANIA which were exposed as scams. Recent incidents have caused investors to maintain caution during their trading activities. The market demonstrates its unsettled emotions through lower buying and selling frequency and growing precautionary measures from traders.
Solana Price Faces Key Support Level Test
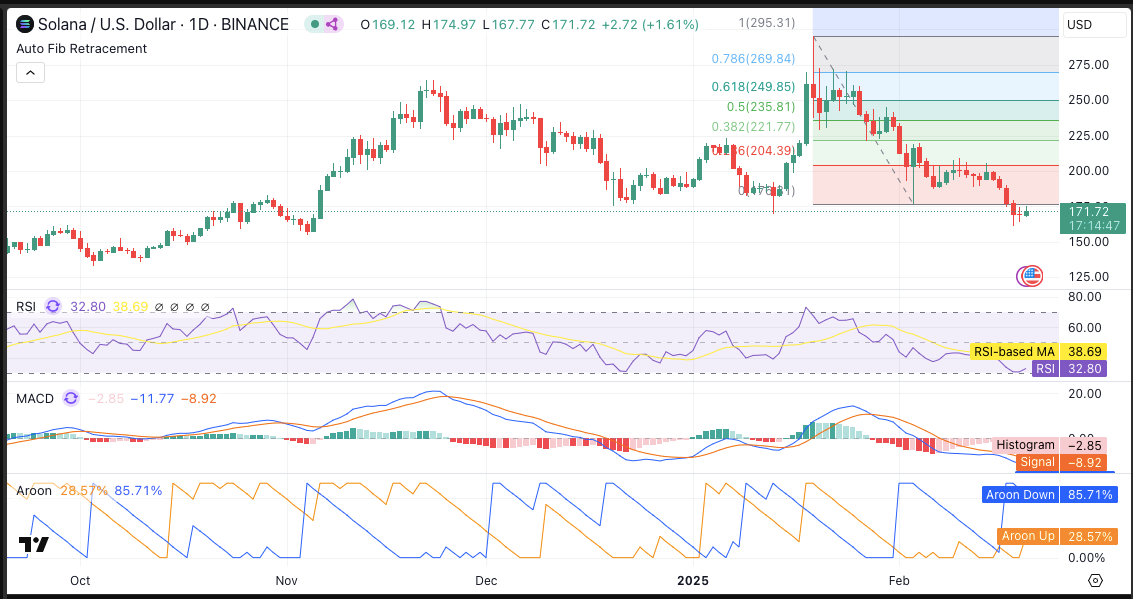
Solana is currently trading at around $171, reflecting a modest gain of 1.61% in the past 24 hours. However, the cryptocurrency remains downward, indicating that sellers maintain control. Further declines could follow if the price fails to hold key support levels.
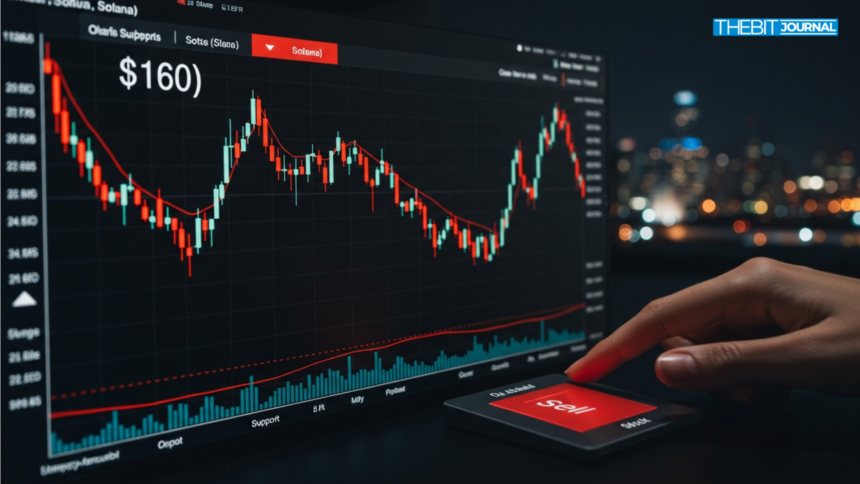
The recent price action indicates that SOL is testing the lower Fibonacci retracement zones. A successful hold at $160 support could push the price toward the $180–$185 range. However, a break below this level could accelerate losses toward $150–$155, potentially dropping to the $125–$130 range if selling pressure persists.
The Relative Strength Index (RSI) is near oversold levels, currently at 32.80. If buying pressure increases, a rebound could occur, but market conditions remain uncertain. The indicator suggests SOL might experience a short-term bounce before any upward move.
The MACD remains in bearish territory, with the histogram showing negative values. The MACD and signal lines continue trending downward, indicating sellers are still in control. A bullish crossover would be necessary to confirm a reversal, but no such signal has appeared yet.

The Aroon indicator also highlights a strong downtrend, with the Aroon Down at 85.71%. Meanwhile, the Aroon Up is at 28.57%, showing that downward momentum remains dominant. Until this trend weakens, Solana’s price could remain under pressure.
Solana Funding Rate Signals Market Uncertainty
The volume-weighted funding rate for Solana has fluctuated between positive and negative territory in recent months. The December funding rates indicated optimism, which seems to have given way to increasing uncertainty throughout recent time periods. The current funding rate shows almost no movement, neither in a positive nor a negative direction, indicating traders remain unsure about future market movements.

The continuous appearance of negative funding rates indicates that short positions dominate SOL, generating more downward pressure on its price. The funding rates plummeted in mid-January, followed by early February, just as SOL prices decreased, highlighting a substantial bearish influence. When funding rates stay stable in positive numbers, it suggests traders are growing more optimistic about SOL.
The decrease in trading activity has reached 40% during the last 24 hours, indicating dual market participation. Market price could experience additional depreciation when trading volume remains low, along with negative funding rates. Positive funding coupled with rising trading volume has the potential to trigger an opposing market trend.
Short Liquidations Rise as Price Moves Up
Solana has experienced significant liquidation activity, with both long and short positions affected by market fluctuations. Coinglass data indicates that long positions such as SOL have faced higher levels of liquidation throughout price correction periods. Price movements in SOL’s market are causing numerous traders to be surprised by SOL’s price sharpness.

The price made targeted increases, which led to a large number of short positions being liquidated. The traders speculating a price decrease must close their positions ahead of schedule, possibly because current market conditions are not in their favor. Major liquidations cause market volatility to rise because they create unpredictable price fluctuations.
When market trading volume increases while the number of traders exiting their long positions falls, this indicates new potential market interest. The probability of an opposing trend might form when buying pressure approaches vital support points. Persistent market liquidations will probably drive reduced asset values, which would amplify present price drops.
Conclusion
Solana remains under pressure as technical indicators point to a continued bearish trend. With key support levels being tested, traders watch for potential reversal signs. If SOL breaks below $160, a drop to the $150–$155 range becomes likely.
The upcoming token unlocks and ongoing liquidation activity adds further uncertainty to the market. Investors should monitor funding rates, RSI levels, and MACD signals for potential trend shifts. SOL needs to reclaim resistance levels above $200 for a sustained recovery and to regain market confidence.
FAQs
What is causing Solana’s price decline?
Solana’s price decline is driven by technical weakness, upcoming token unlocks, and bearish sentiment in the broader crypto market.
What key levels should traders watch?
Traders should monitor the $160 support level and the $180–$185 resistance range. A break below $160 could lead to further losses.
How do liquidation events impact Solana’s price?
Liquidation events create volatility as forced selling or buying can accelerate price movements. High liquidation levels can trigger rapid price swings.
Is Solana oversold?
The RSI indicates that Solana is near the oversold territory, suggesting a possible short-term bounce if buying pressure increases.
What needs to happen for Solana to recover?
Solana must reclaim resistance above $200, and show increased trading volume to confirm a bullish reversal.
Glossary
Support Level: A price level where buying interest is strong enough to prevent further declines.
Resistance Level: A price level where selling interest is strong enough to prevent further gains.
MACD (Moving Average Convergence Divergence): A trend-following indicator that shows momentum shifts.
RSI (Relative Strength Index): A momentum indicator that identifies overbought or oversold conditions.
Funding Rate: The cost of holding leveraged positions in perpetual futures markets.
Liquidation: The forced closure of a trading position due to insufficient margin.


