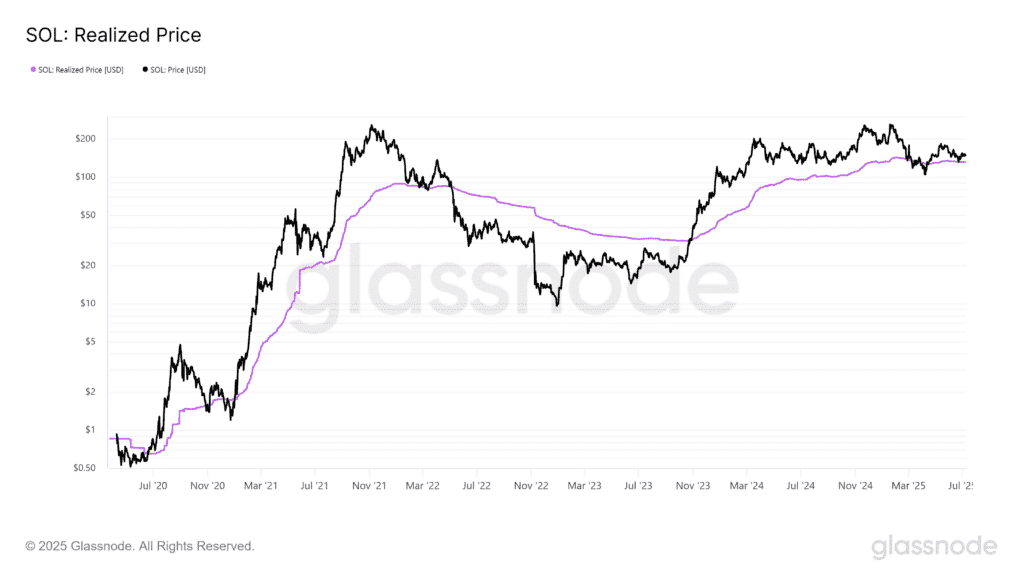
Solana’s long term outlook rests on a technical setup where the realized price around $131 on recent measures acts as the switch. While the July compression breakout offers upside, hedging behavior in the derivatives market is a warning sign.
Without spot conviction and with Option Put/Call ratios turning bearish, Solana price prediction needs structural support to confirm a bullish view; a drop below the realized price of $131 could kill the thesis entirely.
Technical Base: Compression Breakout vs. Hedge Pressure
Solana broke out of a tight July compression channel, a common start of new up moves. But the derivatives market tells a different story. Between July 7-9, the Option Put/Call ratio went from 0.35 (bullish) to 1.19 (bearish), meaning people are buying put positions. Open Interest (OI) is stuck at $7.1 billion, offering not much new buying conviction.
In previous times, SOL reached similar OI levels during Q2’s $4-7 billion recovery phase. The stagnation means the breakout lacks depth, likely driven by short-term longs rather than fundamental buying.
Meanwhile, spot market Cumulative Volume Delta (CVD) has softened in early July according to Coinalyze, meaning there’s no real demand behind the rally. The 11% OI increase is speculative positioning, which is good for quick moves but risky without spot demand.
So, for long-term Solana price prediction, SOL needs structural strength and broader adoption cycles rather than just leveraged capital.

Bull Case: Technical Upside and ETF Catalyst
A sustained move above the compression highs could take SOL to $160-$165; a typical target range (5% from breakout). If leveraged liquidation happens, spikes to $154.60-$158 are possible before a retrace to support zones.
Q3 could be the quarter where sentiment shifts if a Solana ETF or tokenized access product launches. Institutional approval often brings big inflows and reinvigorates spot and OI growth, confirming the long-term Solana price prediction. This could boost both spot and OI.3.
Above the current realized price means SOL’s long term bullishness is intact. Most holders are in profit so they won’t panic sell and support a recovery above realized value.
Bear Case: Hedge Signals and Breakdown
Failure to hold the Realized Price below $131, the average entry price for most holders, would kill the bullish structure. Risk control selling, margin liquidation, and loss-triggered cascades would follow, and support levels would be nearer $115-$120.
More hedging via put positions means sentiment reversal. If Option OI becomes heavily skewed towards protective puts, it may mean bearish conviction, including profit-taking rallies rather than breakouts.
Without spot demand confirmation, rallies are vulnerable. If CVD declines further or net selling continues, leveraged longs will get squeezed and we could see a quick drop. In this scenario SOL could retest lower zones, maybe $125 or below.
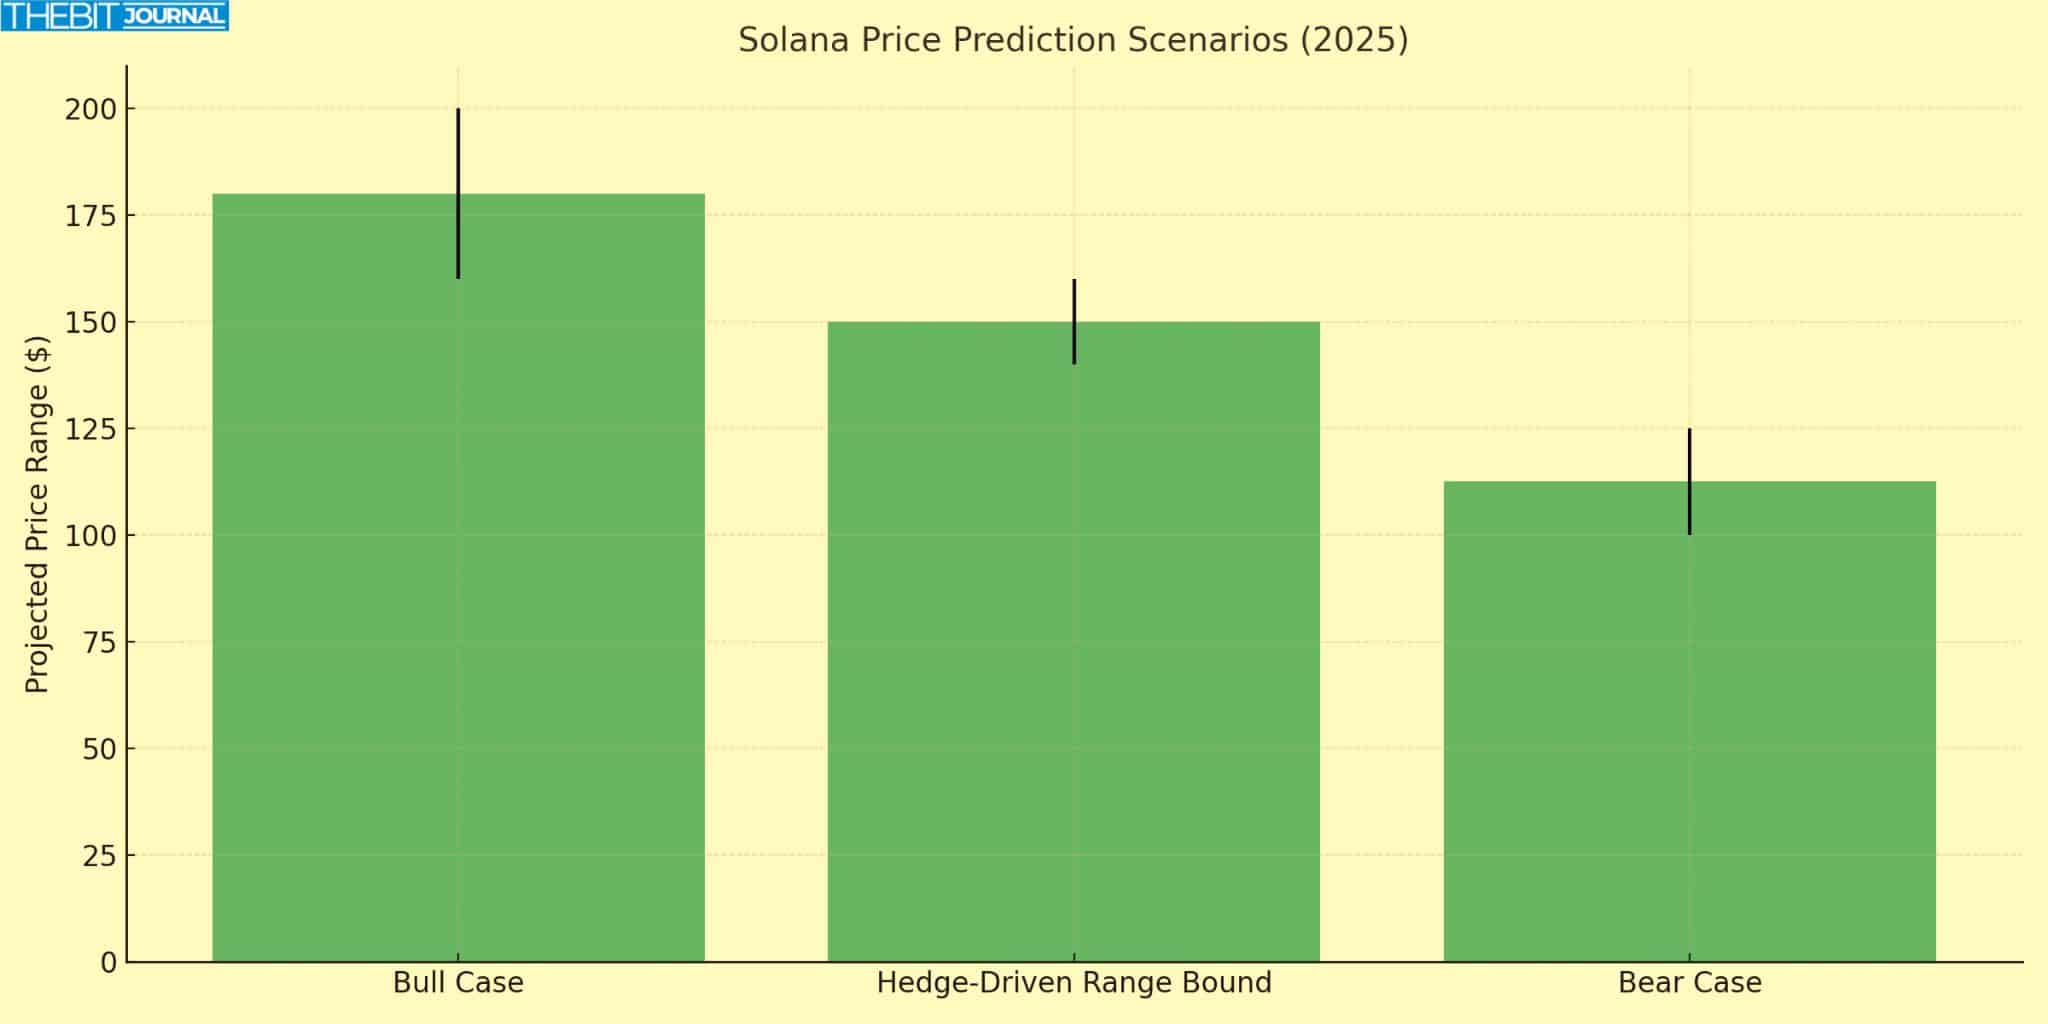
Solana Price Prediction Scenarios
| Scenario | Trigger Condition | Projected Range |
| Bull Case | Maintains > $131, OI resumes growth, ETF signals | $160 – $200 |
| Hedge-Driven Range Bound | Holds $131 but spot weak, high put skew | $140 – $160 |
| Bear Case | Breaches $131 with weak demand | $100 – $125 |

Macro & Market Drivers to Watch
FOMC Minutes & Interest Rates: Hawkish tone translates to less crypto risk; dovish tone supports more crypto rebound.
Externally driven signals, e.g., Solana ETF or Institutional Listings, can change the game. On-chain metrics, Such as Active addresses, transaction fees, and network adoption, will drive credibility.
Crypto Market Sentiment: Risk-index trends in Bitcoin and broader altcoins can amplify SOL’s momentum if positive.
Conclusion
Solana price prediction is at a crossroads. The compression breakout has potential but lacks spot conviction and rising hedging in derivatives means no clear path. If SOL sees institutional flows or ETF-style access, it can go to $160-$200. Below $131 realized price removes its structural support, down to $125 or lower. Traders are advised to watch price structure, hedging and macro-crypto drivers before getting optimistic.
Summary
Solana’s breakout from compression has the potential to $160-$165, but rising bearish options and stagnant spot demand mean no follow-through. Key support is at $13, if this breaks, the bullish structure is invalid. A Solana ETF or institutional inflows would be a major catalyst, failing to hold current levels exposes to $125 or lower.
FAQs
What is the “realized price,” and why is it important for SOL?
Realized price is the average cost basis of all holders. Above this level means holders are profitable and less pressure down.
Why is the Put/Call ratio important for SOL’s forecast?
Higher Put/Call ratio means hedging or bearish sentiment. If buyers are buying puts, it means the breakout has no conviction and will reverse.
What would a Solana ETF do?
An ETF means institutional inflows. It will validate SOL and move capital permanently into crypto infrastructure, boosting demand and liquidity.
How should long-term investors position based on this?
Watch if SOL holds $131. If it does, expect a probable move to $160+. Below that, conservative strategies and stop-losses.
Glossary
Realized Price: Average cost basis of all holders.
Put/Call Ratio: Sentiment indicator comparing put volume or open interest to call volume or open interest.
Open Interest (OI): Unsettled derivatives contracts.
Cumulative Volume Delta (CVD): Net spot market buying and selling.
Leverage Long: A position taken with borrowed capital to amplify gains, but with more risk.


