Solana (SOL) has continued to be volatile in the markets, and the OI data reveals that the upcoming price action may happen in two particular zones. Buying has remained strong at $190, which has confined the declines, and $199 has become a bear pressure, which was acting as a support point. Traders and analysts watch these levels to determine if Solana can continue with the breakout formation or if it will reverse.
Overview
Solana proves to have considerable volatility, and Open Interest helps to analyze the market’s conditions. According to Hyblock, a 3-day OI heatmap of the derivative has also brought out these levels of lower price bands, indicating good buying/selling zones. The cryptocurrency is currently hovering around $202.06 at the time of writing, with traders questioning whether the consolidation above $199 is a sign that the price will continue up and through $200 or is a precursor to a retreat to $190.
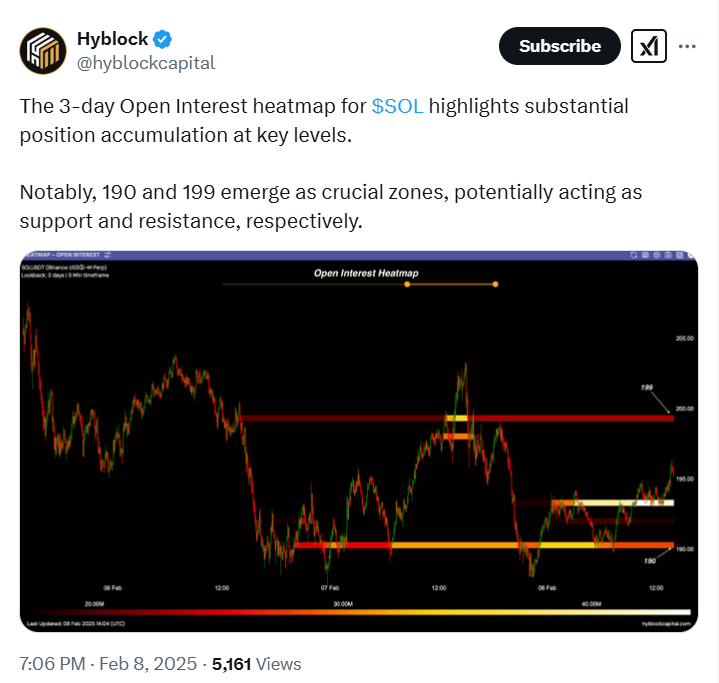
Solana’s Open Interest Heatmap Reveals Critical Levels
$190 Support Level: This price level is a “buy back” that has been gathering in this area and is thus vital for the bulls.
$199 Resistance-Turned-Pivot: The orange line at $199 was previously a level that the cryptocurrency price resisted breaking above for quite a period but is now a level of support.
What Makes $190 a Strong Support?
A most significant feature of $190 is that it has consistently been forming an important support against sell-offs to establish a long position concerning substantial OI accumulation. Market participants believe this area is a good place to open long positions, given Solana’s behavior in such cases in the past.
If $190 cannot hold as support, there could be a selling pressure, possibly towards a further lower price level.
Will $199 be sustained as a Support level?
For the case of $199, it has transitioned from being a resistance level to being a pivot level. This being the case, the price of Solana may continue to rally if it sustains a position above this level. Holding above $199 will increase the possibility of a further rise to $205 or higher.
Nevertheless, if Solana’s selling price is below $199, the price action can be a fake-out, which may lead to consolidation at that level or a downtrend to $190.
Market Liquidity and Open Interest Trends
Fluctuations in the liquidity greatly determine the Solana token’s next course of action. Liquidity during the $199 breakout attempt is suspected to have reached nearly $40 million in Open Interest, therefore, trader examine if this is sustainable to drive further price higher.
The combination shown in the chart showing High OI between $190 to $199 represents that any kind of breakout from this level extreme can result into sharp volatility.
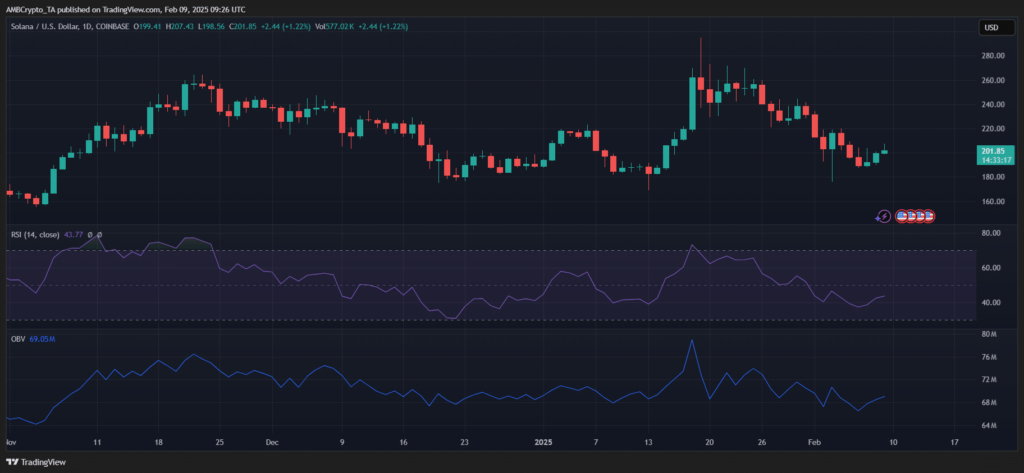
Technical Indicators: Mixed Signals for Traders
Technical analysis parameters present the mixed near-term trend for Solana:
Relative Strength Index (RSI): At 43.77, this is considered mildly bearish in the current market.
On-Balance Volume (OBV): Currently at 69.05, showing an encouraging market involvement however, a strong bullish confirmation is still pending.
Potential Scenarios for Solana’s Price Movement
Bullish Scenario
If Solana remains above $199 and trading volumes do rise, it will rise more towards $205 and above. Continued buying may lead to additional price increases for the equity.
Bearish Scenario
A support level is healthy if it holds a stock price from falling further and the $199 has been failing to offer this measure of support, this could lead to the price going back to $190 as the lowest level. If the price breaks below this level, further selling pressure may be initiated.
Why Open Interest Matters for Solana Traders
Open interest is always important as it provides information about market sentiment and future movements. These tools help a trader find accumulation zones, price levels of resistance and places where the supply and demand balance alters.
Conclusion
Sol current price is confined between $190 and $199 and something meaningful in open interest can be witnessed there. This level has been tested today around $199, and if it holds, the break out of this descending triangle looks likely to follow through to higher levels. This makes it important for traders to keep an eye on the volume level and issues relating to technical and liquidity changes for the next big move.
The BIT Journal is available around the clock, providing you with updated information about the state of the crypto world. Follow us on Twitter and LinkedIn, and join our Telegram channel.
Frequently Asked Questions (FAQ)
Why is $190 a crucial level for Solana?
It has consistently acted as a strong support zone where buyers step in to prevent further declines, making it a key level for bullish traders.
What role does $199 play in Solana’s price action?
Previously a resistance, $199 has now become a pivot point, determining whether Solana can sustain its breakout or face renewed selling pressure.
How does Open Interest influence Solana’s market movements?
High Open Interest at key price levels indicates strong liquidity zones, helping traders anticipate breakouts, reversals, and potential volatility.
Can Solana maintain its momentum above $200?
If Solana consolidates above $199 with rising volume, it could push toward $205, but failure to hold may lead to a retest of $190.
Appendix: Glossary of Key Terms
Open Interest (OI): The total number of outstanding contracts in the futures or options market, indicating market activity and sentiment.
Support Level: A price point where an asset tends to find buying interest, preventing further decline.
Resistance Level: A price point where selling pressure typically emerges, preventing further upward movement.
Liquidity: The availability of assets for trading, which affects how easily a price can move.
Breakout: When the price moves above a defined resistance level or below a support level, signaling potential trend continuation.
Fakeout: A temporary price movement beyond a key level, followed by a reversal, misleading traders.
References
AMB CRYPTO- ambcrypto.com
TradingView- tradingview.com
CoinMarketCap: coinmarketcap
