Stellar (XLM) has jumped ahead of SUI by market capitalization following a strong 11% spike in the past 24 hours. This surge, which propelled XLM to a recent weekly high of around $0.467, puts it firmly at the 12th spot among top cryptocurrencies. With a market capitalization now standing at approximately $14.21 billion, traders and analysts alike are closely watching whether XLM can maintain its upward momentum toward $0.52—and possibly beyond.
A New Spot in the Crypto Rankings
XLM’s market cap rise has been nothing short of impressive. Shortly after overtaking SUI, Stellar now seems within striking distance of Avalanche (AVAX), whose market cap is hovering around $15.34 billion. This development sparks questions about whether Stellar could become a top-ten crypto. To achieve that milestone, it would need to add over $5 billion more to its valuation, surpassing Tron (TRX).
Chart Patterns Signal More Upside
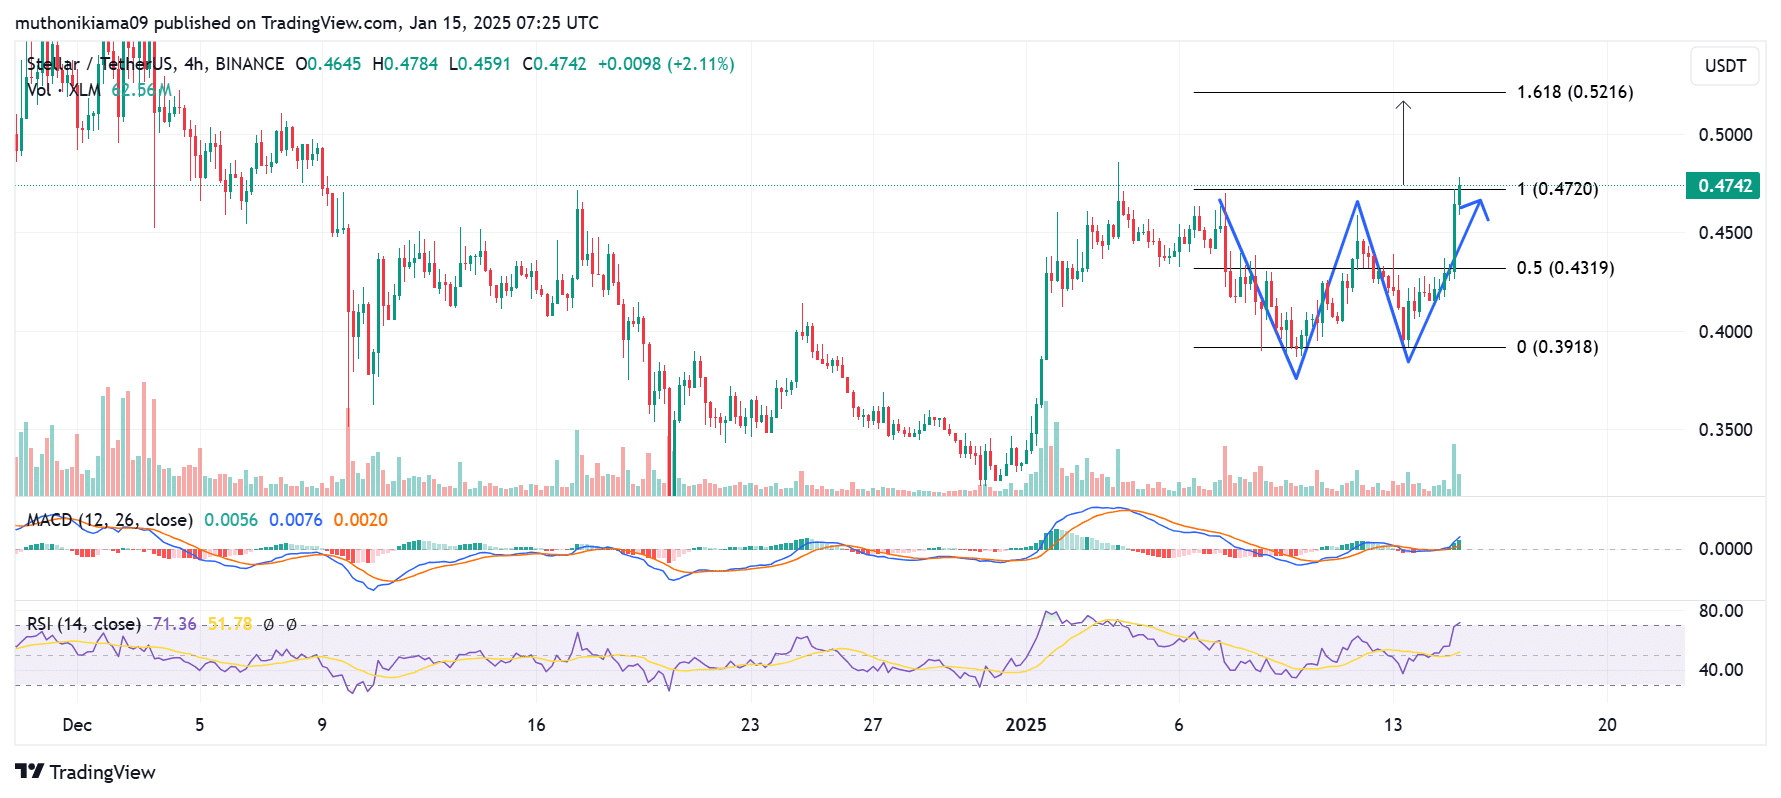
A key driver behind Stellar’s recent price rally is a double-bottom pattern observed on its four-hour chart. Technical analysts often view this formation as a strong hint of ongoing bullish momentum. Notably, XLM has flipped a critical resistance at the neckline of this pattern, signaling that buyers may be in firm control.

The next logical price goal appears to be around the 1.618 Fibonacci extension level at $0.52, a move that would match monthly highs and potentially fuel further investor enthusiasm.
Key Indicators Support Bullish Outlook
Multiple indicators reinforce the notion that XLM’s rally could continue in the short term:
- Volume Histogram: Buying volume soared to $154 million, reflecting a surge in demand that helped push the token’s value higher.
- Relative Strength Index (RSI): Currently around 71, the RSI suggests XLM is nearing overbought territory, a signal that some investors may begin taking profits soon.
- Moving Average Convergence Divergence (MACD): With a positive and upward-tilting MACD line, bulls appear to have the upper hand.
These metrics, taken together, indicate strong momentum. However, rapid gains can also invite sharp corrections if the broader market turns bearish.
Liquidation Levels and Risk Factors
In the wake of XLM’s gains, an estimated $1.5 million in short positions were liquidated, possibly prompting more traders to go long. Coinglass data shows that funding rates for XLM have flipped positive, hinting that longs are now willing to pay extra fees to hold their positions in anticipation of further upside.
Despite this optimism, potential pitfalls remain. One critical zone to watch lies between $0.40 and $0.41, where a cluster of liquidation levels could act as a magnet if the price suddenly dips. A surprise downturn might trigger a chain reaction, forcing long traders to close positions en masse and leading to a steeper decline.
Stellar’s Path Toward the Top Ten
Buoyed by its recent surge, Stellar now faces fresh questions about its long-term trajectory. While flipping AVAX seems achievable if current market trends hold, the bigger challenge is overtaking Tron to secure a top-ten spot. Recent history hints that XLM can accumulate billions in market cap within days, yet sustaining such a rapid climb often depends on broader market sentiment and consistent buyer support.

Conclusion
Stellar’s remarkable climb past SUI underscores the market’s growing confidence in its technology and adoption potential. The immediate question is whether XLM can reach its next probable target of $0.52 without retracing significantly. Should the bulls maintain their grip, Stellar might soon challenge higher-ranking rivals, nudging its way closer to the elite top ten.
For now, market participants will keep a watchful eye on liquidation hotspots, chart patterns, and momentum indicators to gauge whether it can maintain its breakneck pace or face a near-term pullback. While nothing is guaranteed in the ever-volatile crypto space, XLM’s recent performance makes it one of the most closely watched tokens on the market.
Stay tuned to The BIT Journal and watch Crypto’s updates. Follow us on Twitter and LinkedIn, and join our Telegram channel to be instantly informed about breaking news!
Frequently Asked Questions (FAQs)
- Why did Stellar leap ahead of SUI by market cap?
A strong 11% price spike pushed it to around $0.467, solidifying its move to the 12th spot. - Can XLM realistically aim for the 10th spot in the crypto rankings?
Yes, but it would need to add over $5 billion in market cap to surpass Tron (TRX). - What chart pattern underpins XLM’s bullish momentum?
A double-bottom formation on the four-hour chart signals ongoing buyer strength. - Why is $0.52 a key price target for XLM?
It aligns with the 1.618 Fibonacci extension level, indicating a pivotal resistance zone. - Which indicators support a continued rally for Stellar?
Soaring buying volume, an RSI near 71, and a positive MACD all point to ongoing bullish sentiment.


