The meme coin market has been experiencing significant corrections lately, with Dogecoin (DOGE) dropping approximately 18.5% in the past week. Meanwhile, newer competitors TRUMP and MELANIA have seen even steeper declines, falling by over 30% and 25%, respectively. However, according to experienced technical analyst Yashu Gola, there are emerging signs of a potential bullish reversal for meme coins.
DOGE Prepares for a Potential 30% Surge!
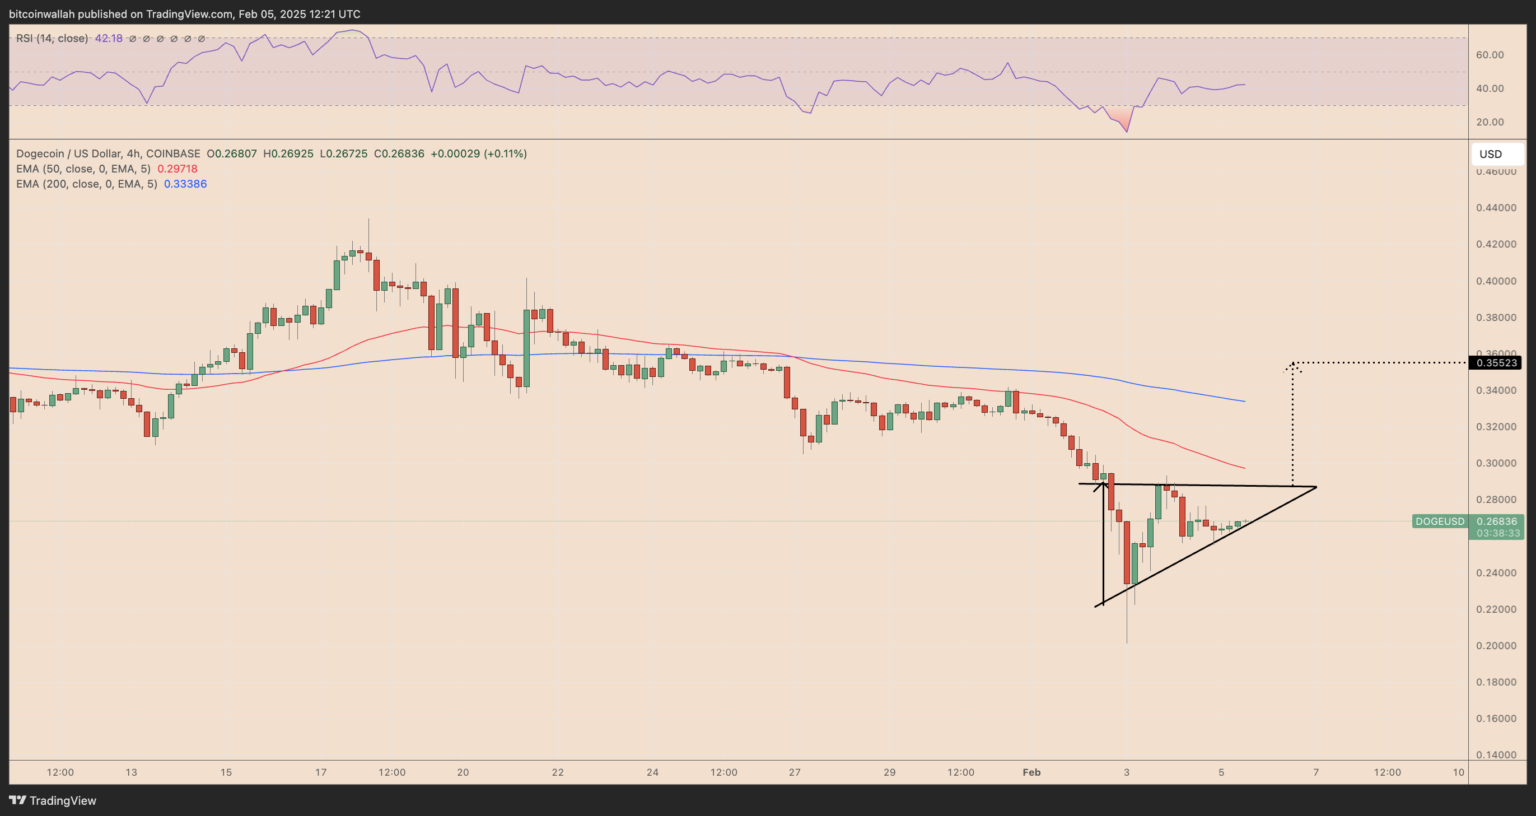
Dogecoin (DOGE) is showing signs of a bullish breakout from an ascending triangle formation, hinting at a possible 30% rally in February. The DOGE/USD 4-hour chart highlights a tightening price range with a resistance level near $0.28 and a series of higher lows, indicating growing bullish momentum.
If DOGE successfully breaks above the upper trendline of this triangle, it could rally toward its technical target of $0.35. However, if it fails to sustain its breakout and drops below the lower trendline, bearish risks could resurface, potentially driving the price down to the $0.23-$0.20 support zone. The Relative Strength Index (RSI) remaining below 50 suggests cautious optimism, while traders will be watching for a daily close above $0.28 to confirm the bullish setup. A drop below $0.25 could invalidate the rally and trigger a deeper correction.

TRUMP Shows Early Signs of Bullish Divergence
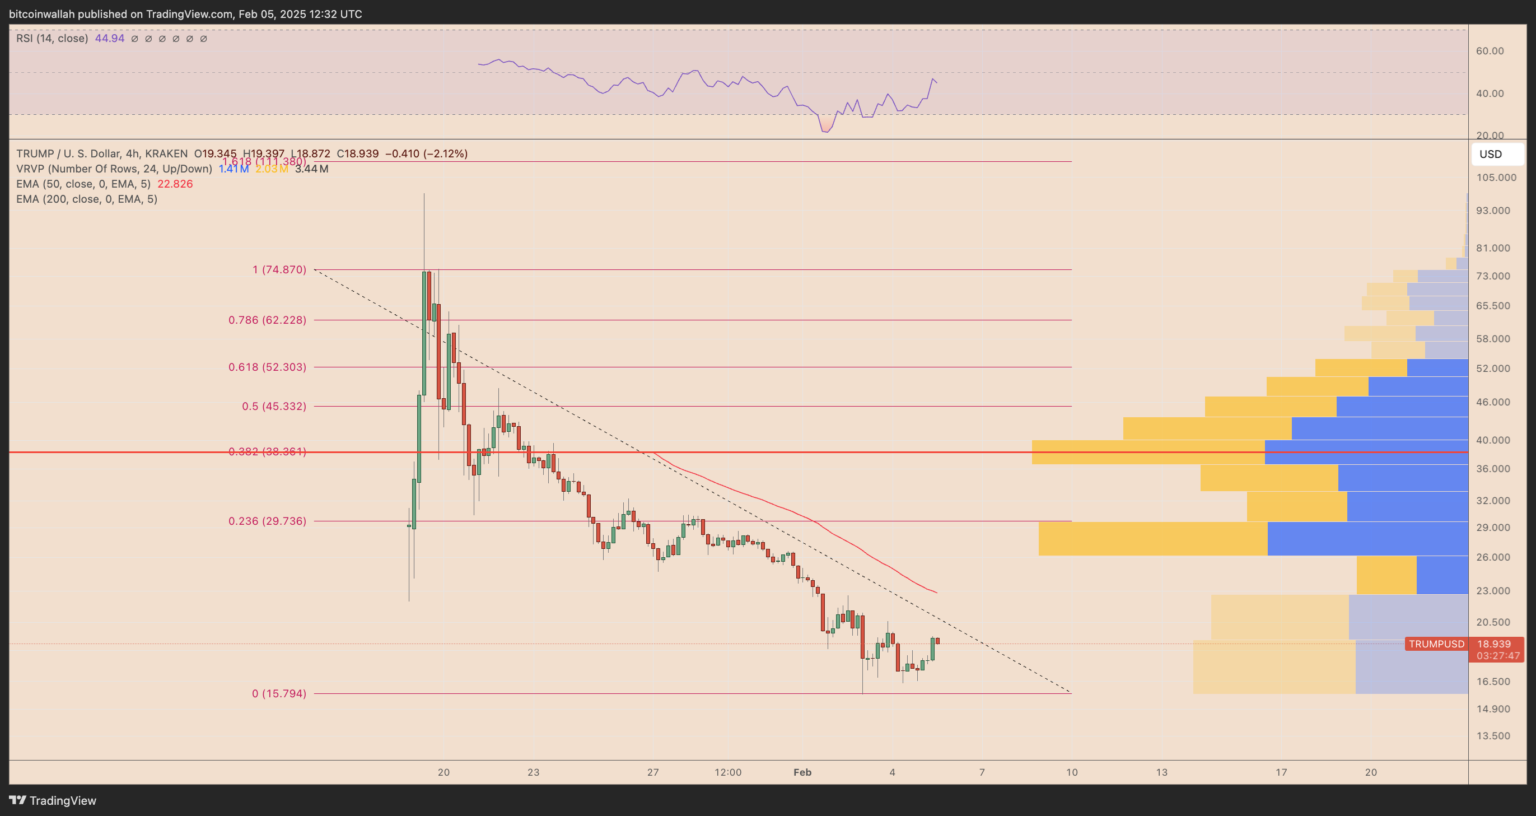
The Official Trump (TRUMP) meme coin appears to be on the verge of a potential reversal following a prolonged downtrend. The TRUMP/USD 4-hour chart exhibits bullish divergence between price action and the RSI, signaling weakening downside momentum.
TRUMP recently found support near $15.80, aligning with a key Fibonacci retracement level. Meanwhile, RSI has been rising despite lower price levels, indicating growing buying pressure. A breakout above the descending trendline could confirm a short-term reversal, with the next resistance zone set at the 50-day EMA (~$22.82). Higher up, the Volume Profile Visible Range (VPVR) highlights a crucial liquidity area between $29 and $39, where Fibonacci resistance at $29.73 and $39.36 also aligns. Reclaiming these levels could pave the way for an extended rally towards $45.33.
On the downside, failure to break resistance could lead to a retest of $15.80. If this support fails, the next bearish targets could be in the $13.50-$12.00 range, as indicated by low-volume zones on VPVR.
MELANIA Forms a Classic Inverse Head & Shoulders Pattern
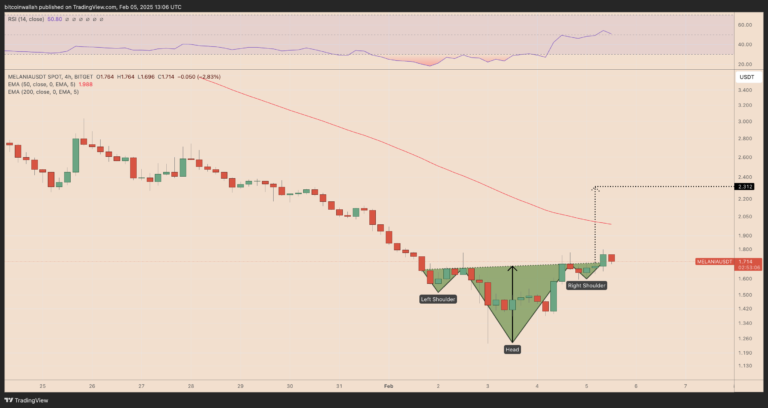
The Official Melania (MELANIA) token has developed an inverse head and shoulders (H&S) pattern on its MELANIA/USDT 4-hour chart, hinting at a potential bullish trend reversal. This classic pattern signals a momentum shift, suggesting that buyers are regaining control after a prolonged decline.
The formation consists of three key elements: the left shoulder, the head (lowest point), and the right shoulder, all forming beneath the $1.70 neckline resistance. MELANIA recently confirmed a bullish breakout by closing above this neckline, setting the stage for a potential rally toward $2.31. Additionally, the 50-day EMA (~$1.98) serves as a crucial resistance level that MELANIA must turn into support to sustain further upside movement.
If buyers manage to push the price beyond $2.30-$2.50, an extended rally could be in play. However, failure to maintain support above the neckline may invalidate the pattern, exposing MELANIA to a potential drop toward $1.50-$1.40. The lowest point of the head at $1.20 remains the last major support.
Final Thoughts
While these meme coins are showing promising bullish patterns, traders should remain cautious and watch for confirmation signals before making any decisions. Volume confirmation and key resistance levels must be breached to solidify an upward trend.
For more in-depth crypto market insights and analysis, stay tuned to The Bit Journal.
- https://twitter.com/Thebitjournal_
- https://www.linkedin.com/company/the-bit-journal/
- https://t.me/thebitjournal
Follow us on Twitter and LinkedIn and join our Telegram channel to get instant updates on breaking news!


