Chainlink price is balancing on a critical technical line, and the outlook of investors is more on the unfriendly side as the world becomes more uncertain. A consolidative week has now put LINK in a critical area of make or break, with historical resistance likely to handle any upcoming trend.
The data on-chain and technical indicators also point to a bearish pressure on the asset, with leveraged traders placing theirarius on a bearish breakout. The next few days will show whether the trend of the Chainlink price will be able to overcome the odds-or keep going down.
Bearish Leverage Builds Against Chainlink
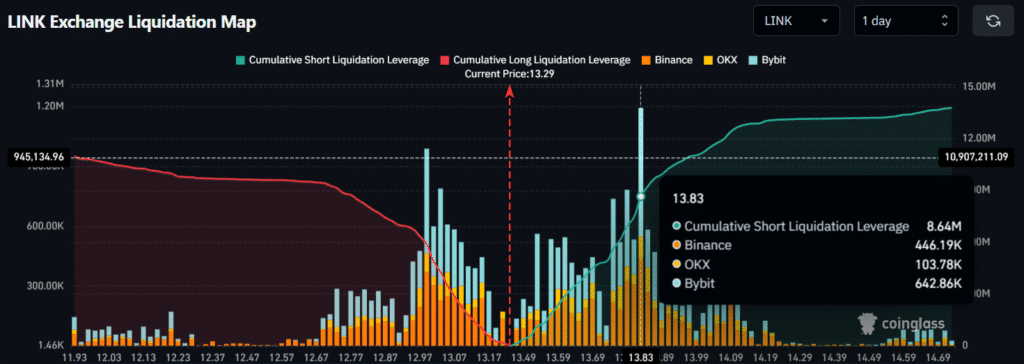
Onchain data published by CoinGlass on July 8 indicated that leveraged trading positions were in a precipitous decline. Traders had opened long positions worth of $5.87 million but the higher short positions of $8.64 million.
Chainlink price is now a center of the bearish speculation and the funding fees show rising appetite of risk among the shortsellers. As of now, LINK is trading at $13.99, up by 4.89% over the past day.

Long/Short Ratio fell to 0.935, which was an indication of increased traders closing bets against the falls. By the time of writing, 51.68% of market players were in short positions, with just slightly more than half, or 48.32%, still hoping that markets would rebound.

Chainlink Price Struggles Near Key Support Zones
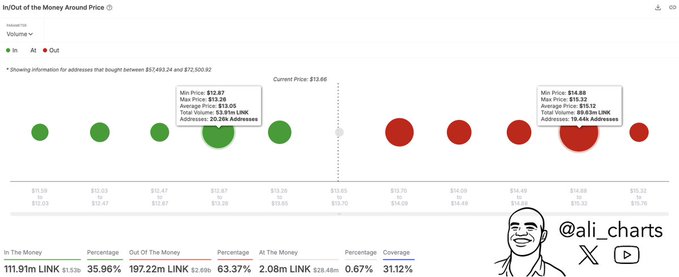
Nonetheless, against all odds of increased sell pressure, Chainlink price has been able to maintain an above the crucial support zone between 12.87 and 13.26. In/Out of the Money Around Price (IOMAP) model by IntoTheBlock showed that more than 20,000 wallets accumulated over $53.91 million LINK at this level.
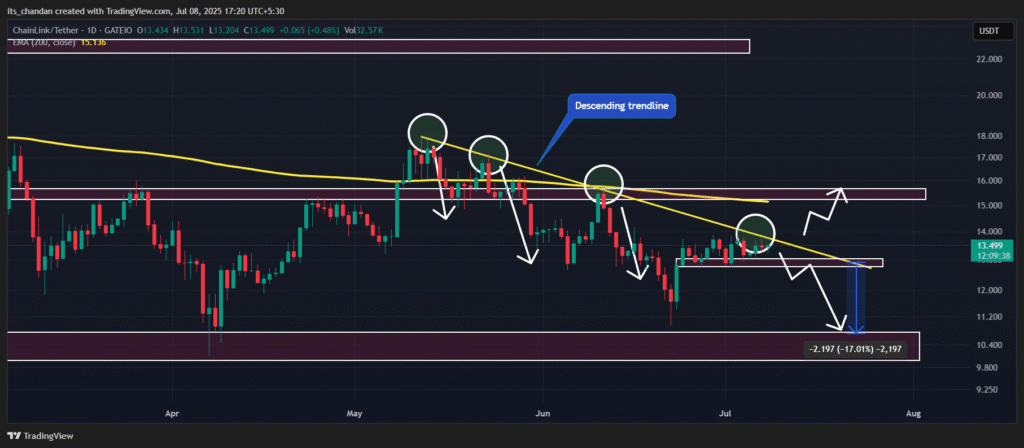
This support can only halt the drop in the short run but that alone might not be sufficient to catalyze revival of the markets unless the directional momentum in the market changes remarkably. In case the price declines below $12.70, analysts signal a short-term correction might be 17%.

Fourth Test of Descending Trendline Resistance
Chainlink price is back again at the door of a well-established descending trendline, as the fourth time. All the above rejections have resulted in rejections, and it strengthens the trendline as the resistance level.
This is the new field of technical warfare. Frequent failures in closing above the trendline will probably cause additional liquidations and new lows in Chainlink price, although a daily close above the trendline has the potential to inspire a rally.
200-Day EMA Continues to Cap Upside
The long-term outlook is still bearish with Chainlink price being below 200-days Exponential Moving Average (EMA). It is a long-term indicator that shows long-term negative force.
A clean break above the 200-day EMA and consistent price action above $16 will be required to give the bulls control back. A lack of the confirmation leaves the path of least resistance to the downside.
Supply Wall Threatens Upside Breakout
Above the existing price, resistance is also building up. The IOMAP data shows that there is a significant supply cluster of the range between $14.88 and $15.32. About 89.63million LINK were purchased within this range by 19,440 wallets- many of which are now underwater.
Once the Chainlink price reaches this area, selling can go off the hook since holders will want to break even. This poses an imposing challenge in the event of any rally and breaking through this would be vital to unveil price breakouts.

Only 0.67% of LINK Supply Is at Breakeven
The current price structure of Chainlink has a broad gap in the profit realized. The LINK supply consists of only 0.67% in money, and the rest (more than 63%) is out of money. This implies that majority of them are underwater, which may restrict selling on panic grounds by being long-term believers-or it may break out in case there is panic again.
| Month | Minimum Price | Average Price | Maximum Price | Potential ROI |
|---|---|---|---|---|
| July | $12.99 | $13.26 | $13.52 | -0.3% |
| August | $13.91 | $13.89 | $13.86 | 2.2% |
| September | $13.38 | $14 | $14.61 | 7.7% |
| October | $13.60 | $14.18 | $14.75 | 8.8% |
| November | $13.76 | $14.17 | $14.58 | 7.5% |
| December | $13.87 | $14.23 | $14.58 | 7.5% |
Such a situation of unrealized loss is capable of igniting a reversal scenario in the event of a resistance clearance, although up to such a time, it is an exposure to the Chainlink price.
External Tensions Add Pressure to Market
The broader crypto market is also contending with rising global tariff tensions, which have spooked risk-on investors. Assets like LINK—known for volatility—are facing demand headwinds as traders seek stability in uncertain times.
Without relief from external macroeconomic stressors, the Chainlink price may find it difficult to regain momentum, even if technical indicators begin to shift favorably.
Conclusion
Chainlink price is in technical and psychological inflection point. In the short-term perspective, bears are ruling the roost by taking up against any kind of rally. Nevertheless, the minuscule support at lower levels and less aggressiveness amongst proficient areas of sellers can save LINK.
At this time, traders have their attention on the support that is currently at $12.70 and resistance at $15.30. An escape either of the two zones will most probably determine the next leg of the Chainlink price trend.
Summary
The Chainlink price is under pressure as traders adopt a bearish stance amid rising global uncertainty. Technical indicators show LINK consolidating below a key resistance trendline and its 200-day EMA.
On-chain data reveals strong support near $13 but significant resistance near $15.30. With over-leveraged short positions and low breakeven supply, LINK’s next move hinges on breaking resistance or slipping below critical support.
Frequently Asked Questions (FAQ)
1- What is the current trend in Chainlink price?
Chainlink price is in a bearish trend, currently trading below its 200-day EMA and struggling to break key resistance levels.
2- What are the key support and resistance levels for LINK?
Support lies between $12.87 and $13.26, while resistance is clustered around $14.88 to $15.32. A break above $15.30 may unlock higher price action.
3- How are traders positioning themselves in the Chainlink market?
On-chain data shows that more traders are shorting LINK, with a Long/Short Ratio of 0.935. Bearish sentiment dominates in the short term.
4- What external factors are affecting Chainlink price?
Global tariff tensions and macroeconomic uncertainty are creating a risk-off environment, affecting investor appetite for volatile assets like Chainlink.
Appendix: Glossary of Key Terms
Chainlink (LINK) – A decentralized oracle network that enables smart contracts to securely interact with real-world data and services outside the blockchain.
Long/Short Ratio – A trading metric that compares the number of long (buy) positions to short (sell) positions to indicate market sentiment.
Exponential Moving Average (EMA) – A technical indicator that highlights an asset’s trend by giving more weight to recent prices.
Support Level – A price point where demand is expected to be strong enough to prevent the asset from falling further.
Resistance Level – A price level where selling pressure is expected to prevent further upward movement in an asset’s price.
Descending Trendline – A line drawn on a chart that connects a series of lower highs, signaling a continued downtrend.
IOMAP (In/Out of the Money Around Price) – An on-chain tool that shows how many tokens were bought at various price levels to identify support and resistance clusters.
Reference
AMB Crypto – ambcrypto.com


