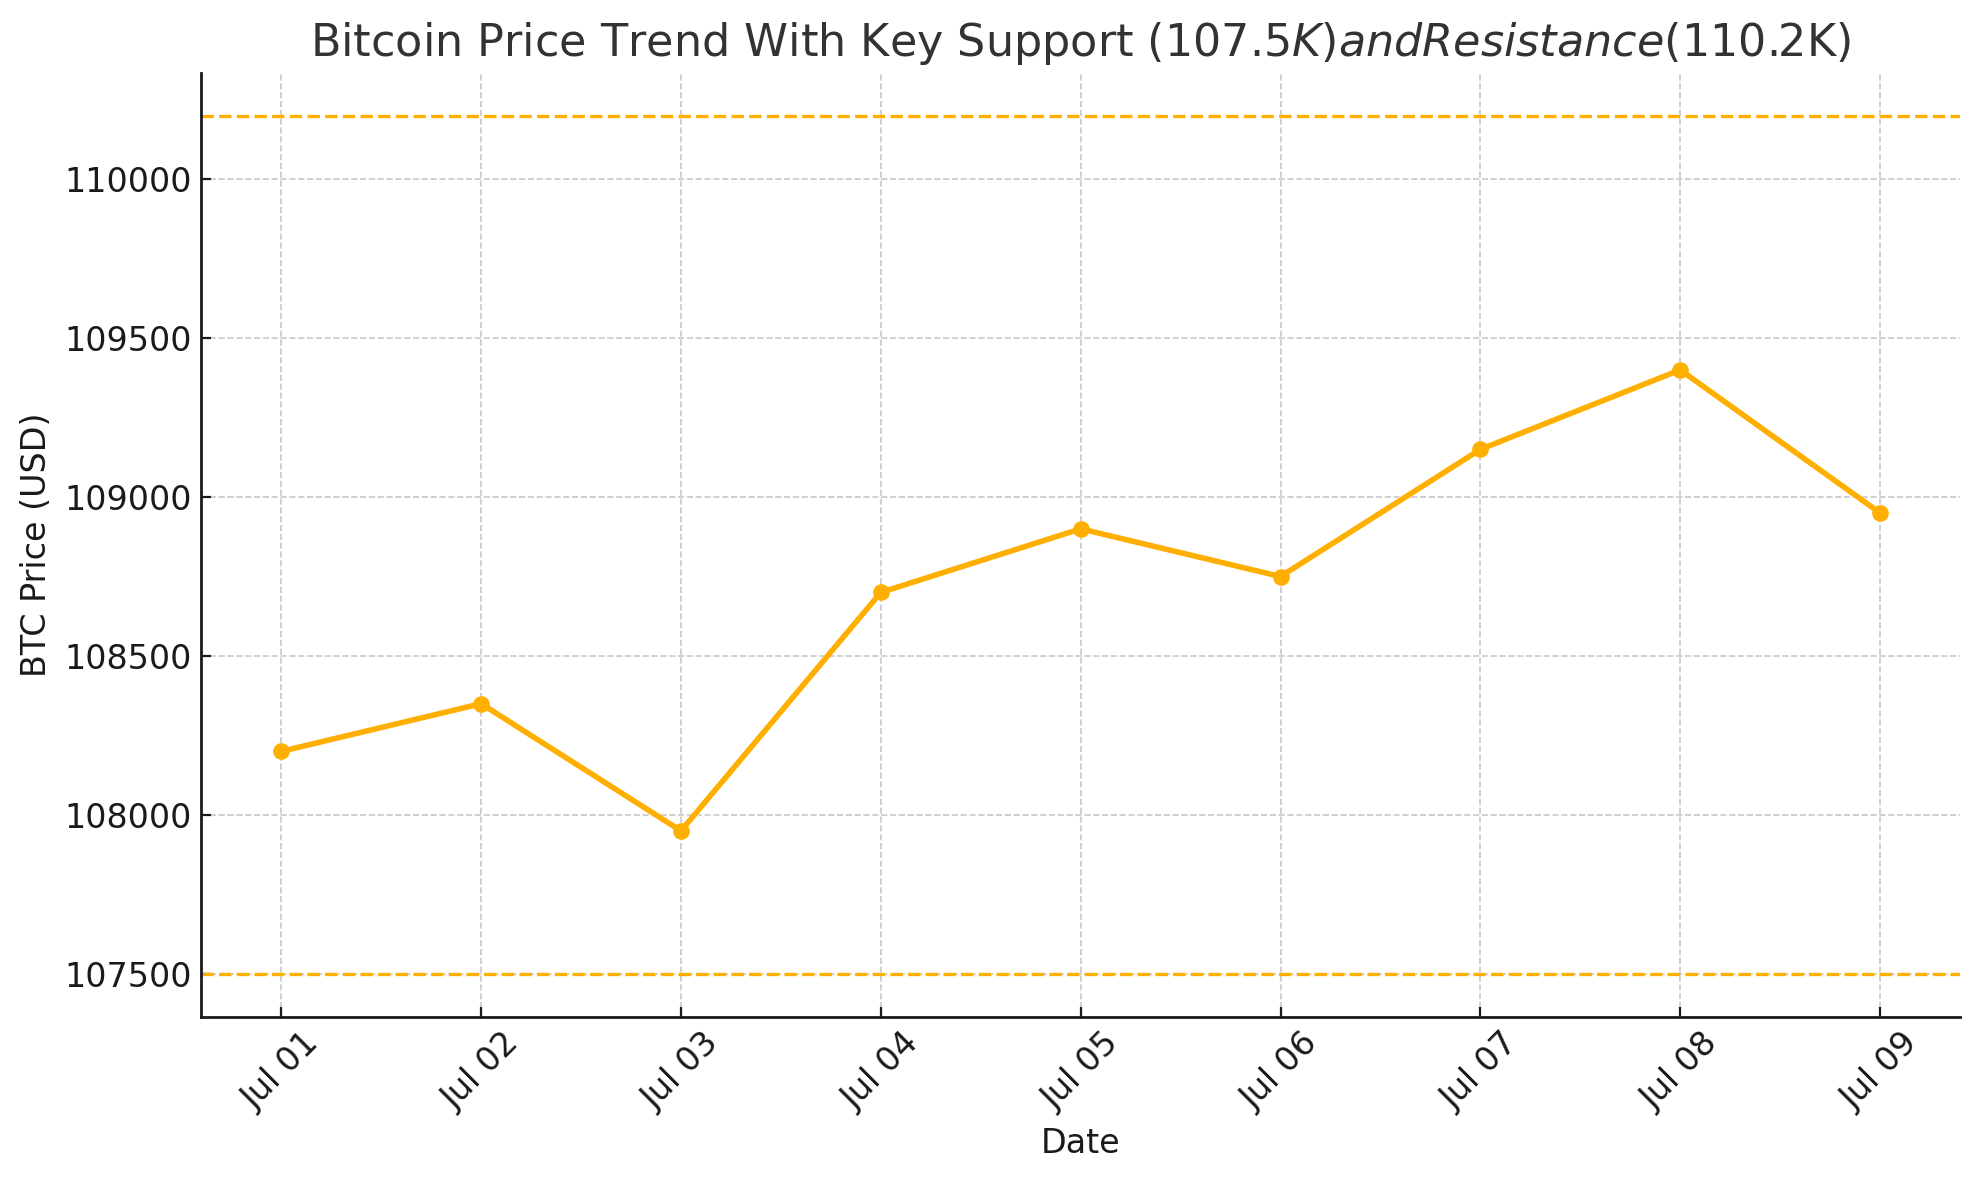
Bitcoin has once again taken center stage. The world’s greatest digital asset is stabilizing just around $110,000, tempting both bulls and bears with a possible breakout or crash. With worldwide experts split and price action tightening, investors are wondering whether BTC will skyrocket this week or fall below its support zone first.
According to Decrypt’s July 8 analysis, Bitcoin is now stuck in a confined range, with higher lows emerging underneath it, an early indicator of bullish pressure brewing. However, when indicators like RSI and MACD show signs of pausing, the issue isn’t whether BTC will increase, but when and how hard.
The Technical Picture: Coil Before the Climb?
Bitcoin’s present configuration resembles a coiled spring. “The charts are setting up for a significant move,” QCP Capital said in a recent market report. “The implied volatility is at a one-year low. Either $100K breaks down or $110K breaks out, whichever comes first may determine the next 20% move.”
Bitcoin is now trading slightly around $109,000, with a short-term resistance zone ranging between $110,000 and $110,200. If BTC can convincingly close above this level, many anticipate it will swiftly rise to $112,000 and beyond. However, a failure here might result in a retest of the lower support band around $107,500, a brief decline down to $99,000.

Institutional Confidence Isn’t Shaking
Despite the short-term hesitancy on charts, the long-term picture remains resoundingly bullish, especially from institutional investors. In its Q3 outlook, Standard Chartered Bank doubled down on its prediction that Bitcoin could reach $135,000 by the end of Q3, and $200,000 by year-end.
“The halving cycle is dead,” said Geoff Kendrick, Head of Digital Assets Research at Standard Chartered. “What’s driving the market now is ETF demand and treasury accumulation. That breaks the traditional 18-month downtrend post-halving. This time, the market is structurally different.”
Supporting that claim, over $770 million in spot Bitcoin ETF inflows were recorded in Q2 2025 alone, according to FXStreet. BlackRock, Fidelity, and Ark Invest have all expanded holdings, signaling unwavering institutional conviction despite short-term volatility.
Retail Sentiment Turns Neutral as Market Awaits Trigger
The market’s Fear and Greed Index, which was firmly in “Fear” area only weeks ago, has returned to “Neutral”. This is consistent with CoinDCX’s weekly prognosis, which predicts that a daily closing over $110,200 would unleash bullish momentum toward $112K and beyond.

Meanwhile, retail traders are accumulating with caution. On-chain data from Glassnode reveals tiny wallet addresses (carrying <1 BTC) are slowly buying the drop, while whale wallets stay completely idle, attentively monitoring the resistance line.
The Bearish Case: A Healthy Correction?
Not everyone thinks a breakthrough is near. Julio Moreno, Head of Research at CryptoQuant, cautioned that a short-term pullback might be beneficial before the next leg higher.
“We could see Bitcoin dip to $99K to retest the realized price mean, which is common before major upward cycles,” said Moreno.
He did, however, warn that any decline below $100,000 was expected to be brief and would be greeted with considerable buying demand from both institutions and individual traders.
Conclusion: Compression Breeds Explosion
Bitcoin is trading in a narrowing range, indicating that a dramatic move is approaching. On the one hand, institutional purchasing and ETF flows continue to support a bullish scenario of $135,000-$200,000. On the other hand, the market remains cautious, with several signs pointing to a short-term decline.
However, one thing is clear: Bitcoin does not sit quiet for long. Whether it breaks out or pulls back first, the next move might determine the last leg of the 2025 bull market. For both traders and investors, this week may be the final opportunity to accumulate before momentum returns in full force.
FAQs
Will Bitcoin surge this week?
It’s possible. Charts show pressure building, but a close above $110,200 is needed to confirm a breakout.
What are Bitcoin’s current support and resistance levels?
Support sits near $107,500; resistance lies between $110,000 and $110,200.
What’s the long-term forecast for BTC?
Standard Chartered sees BTC hitting $135K in Q3 and $200K by end of 2025.
Is a dip below $100K likely?
Some analysts say it’s possible in the short term, but any correction may be brief.
Glossary of Key Terms
RSI (Relative Strength Index) – A momentum indicator measuring overbought or oversold conditions.
MACD (Moving Average Convergence Divergence) – A trend-following indicator showing momentum shifts.
ETF (Exchange-Traded Fund) – A financial product tracking the price of an asset, often used by institutions.
Realized Price Mean – The average price at which all BTC in circulation were last moved; used as a valuation benchmark.
Fear and Greed Index – A sentiment indicator ranging from extreme fear to extreme greed.
Sources
FXStreet Bitcoin Q2 Performance


