XRP continues to show resilience and bullish intent, holding strong at $2.544. With a market cap of $146 billion and 24-hour volume of $9.49 billion, it has been navigating a price range between $2.33 and $2.56. Volatility is all over the place, and technicals are showing a mix of consolidation and upward trend, drawing in traders and investors.
Consolidation Fuels Speculation
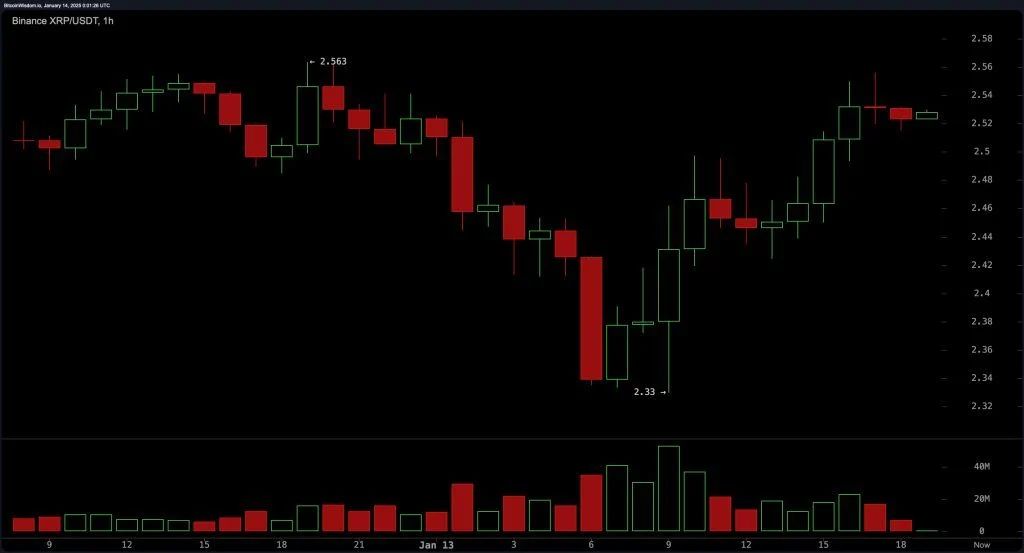
On the 1 hour chart, XRP is consolidating between $2.50 and $2.55 after the recent bounce. Key technicals are showing cautious optimism. The Moving Average Convergence Divergence (MACD) is in a buy zone at 0.08662 and showing sustained upward momentum. However, trading volume has dipped a bit as traders are waiting to see how strong this move is.
This consolidation is giving some intraday entry points for traders, mainly around the support zone of $2.48-$2.50. Conservative stop-losses below $2.45 provides a risk managed approach, $2.55-$2.60 is still a critical exit zone.
Higher Lows on 4-Hour Chart
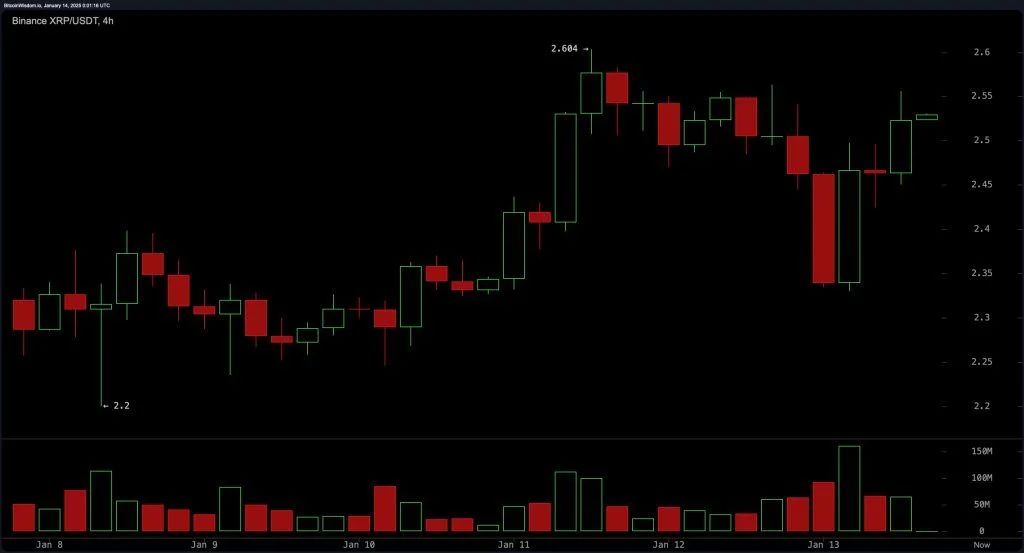
Zooming out on the 4 hour chart for XRP, there is an uptrend with higher lows, but facing resistance near $2.60. Also supporting the bullish view is the exponential moving average (EMA) of $2.43729 and the simple moving average of $2.42029 for the asset.
Note that volume is low at resistance so confirmation should be gotten before a breakout is expected. Retests of the $2.45-$2.50 area may give the best risk/reward entries, with stops below $2.40 on pullbacks.
Daily Chart Shows Bigger Recovery
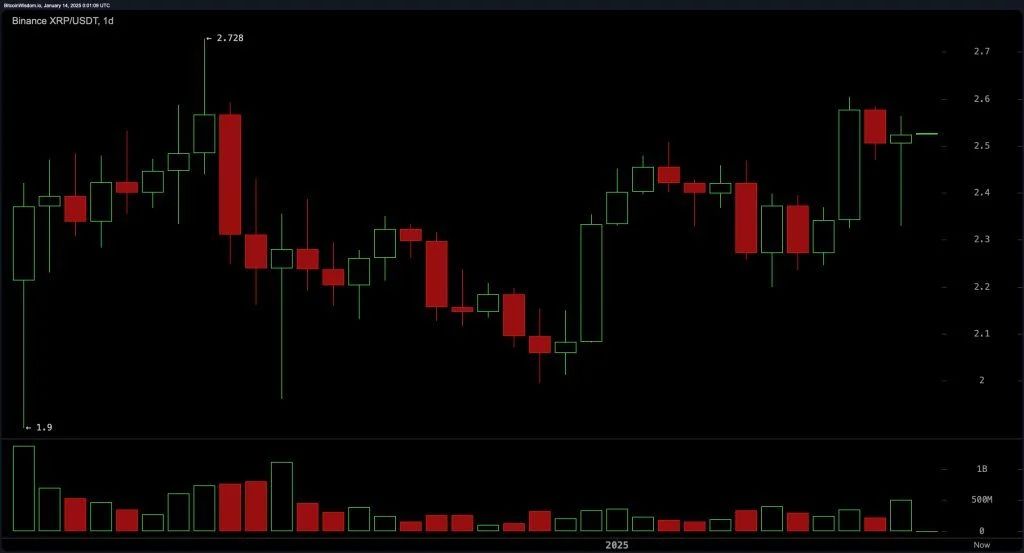
On the daily chart, XRP is looking even more bullish, rebounding strongly from recent lows. Moving averages are aligned across the short and long-term, all signaling buy conditions. EMA (20) at $2.37322 and SMA (20) at $2.32529 is showing near-term strength, and longer-term averages such as EMA (200) at $1.28300 and SMA (200) at $1.02419 is confirming the up trend.
The relative strength index (RSI) at 59.39 remains neutral, suggesting room for further upside. Resistance at $2.70 is shaping up as a significant hurdle, but the lack of overbought conditions provides space for the price to climb higher. However, increasing volume will be crucial for the asset to breach this level and establish a stronger foothold.
Mixed Oscillator Signals
Oscillator Readings offer a nuanced look. The Stochastic Oscillator (%K) is overbought at 85.07, which is a warning for short-term pullbacks. In Contrast, the momentum indicator is at 0.10585, which is deeply in the buy zone. These mixed signals just mean traders need to watch volume dynamics and key levels for further confirmation of direction.
Market Sentiment and View
XRP is still the 3rd largest cryptocurrency by market cap, with enduring attention from investors. The sentiment is bullish because technical indicators, especially moving averages, are showing buy signals from all timeframes. This is further confirmed by the MACD, which aligns with the building momentum.
A breakout above $2.60 with increased volume could be the start of XRP testing $2.70. Beyond that, it could go even higher if market condition is favorable and resistance zones are cleared.
Risks and Caution
Despite the good signs, traders should be prepared for anything. Low volume at resistance means either a small pullback or a bigger consolidation. Failure to hold support above $2.50 or even below $2.45 could mean deeper correction to $2.40.
Also, following the stochastic overbought reading, XRP’s up momentum might be due for a rest. Traders should watch price action around $2.60 area and be ready for volatility at any time especially if broader market conditions change.
Conclusion
The market for XRP is cautiously bullish. How well it holds current momentum with key support and resistance will determine the next move. With a strong buy signal from moving averages and the broader trend is supportive, XRP can go higher to $2.70 and beyond.
Nevertheless, traders should not be complacent with the low volume and mixed oscillator signals. Going forward, entry and exit points and risk management will be key to trade XRP. The next few days will be very important for the asset to see if bulls can continue to be in charge or if bears will take over.
The BIT Journal is available around the clock, providing you with updated information about the state of the crypto world. Follow us on Twitter and LinkedIn, and join our Telegram channel.
FAQs
1. Why $2.70 is the target for XRP?
$2.70 is the resistance level that, if broken, could solidify XRP’s bullish trend, opening the path for more uptrend.
2. What’s the role of volume in price action?
Trading Volume is used as a confirmation tool for directional moves. Higher volume near resistance means strong buying interest, lower volume means caution or consolidation.
3. How do moving averages support the bullish outlook of XRP?
All moving averages for XRP from 10-day to 200-day are in buy zone, meaning bullish sentiment is across all timeframes.
4. What are the risks of buying XRP now?
The risks include low volume around resistance and overbought position, which may trigger short-term correction or consolidation.
5. What’s the trading strategy for XRP now?
Intraday traders might focus on entry points near $2.48–$2.50 with stops below $2.45, while swing traders could target breakouts above $2.60 with conservative stop-loss levels near $2.40. In all, DYOR!


