According to sources, the $XRP price recovery is at an important point as the coin tries to rise above the $3.20 resistance level. It fell under important price levels earlier, but now it’s showing signs of recovery. This has led some to wonder if a bullish reversal might happen next.
Even though the technical signals are unclear, many traders are closely watching to see if the price can build enough strength to cross major resistance points. Many sights bullish target if the price momentum continues.
What triggered the $XRP price recovery?
The $XRP price recovery began when it found support at $3.080, which lines up with a key level between its earlier rise from $3.004 to $3.330. Experts say this point is important. It could help $XRP move up again, or it might just be a short bounce before the price falls further.
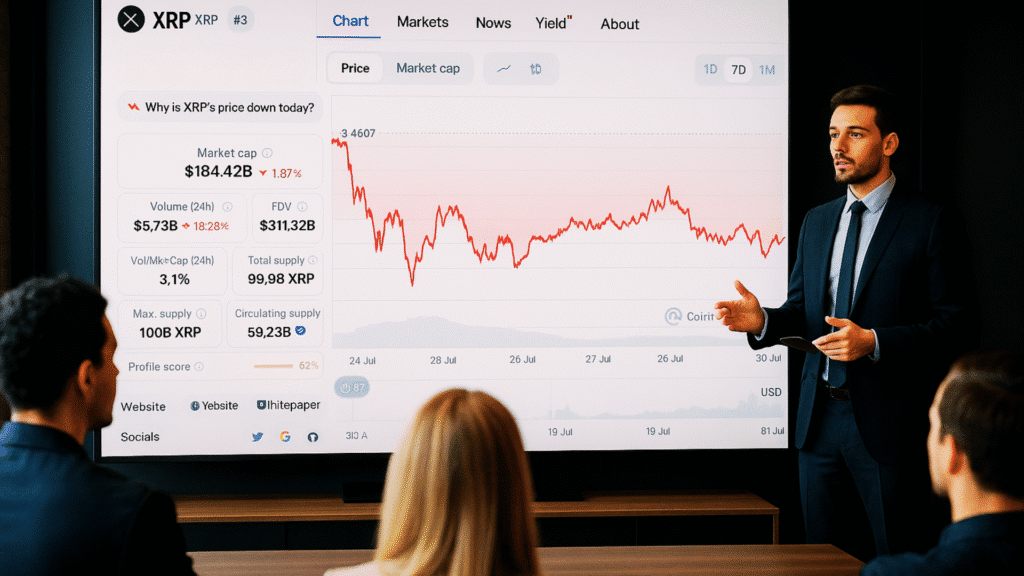
While Bitcoin and Ethereum stayed more stable, $XRP moved differently. It fell below key levels like $3.250 and $3.220, showing that sellers were in control. But a bounce near $3.080 and then a break above a bearish trend line at $3.120 point to a possible change in momentum.
How do technical indicators support or oppose the bullish case?
Charts for the $XRP price recovery are giving mixed signs. On one hand, the Relative Strength Index (RSI) is above 50, which shows that the selling pressure is slowing down.
On the other hand, the MACD is still in the red, meaning the bearish trend is not completely over yet. Also, the price is still below the 100-hourly Simple Moving Average, which often acts as a barrier when recovery is weak.
If $XRP doesn’t clearly break and stay above $3.20, the chances of a strong upward move will stay uncertain.
| Metrics | Value |
| Price Recovery Level | $3.18 |
| Immediate Resistance Levels | $3.20, $3.40, $3.60 |
| Support Levels | $3.00 – $3.10, $2.84 – $2.85 |
| Short-Term Bullish Targets | $3.60 – $3.80, $4.00+ |
| Long-Term Bullish Targets | $5.00 – $6.00+ |
| Market Sentiment | Bullish |
What are the short-term targets and risks?
If momentum grows, experts think the $XRP price recovery might first hit resistance at $3.170 and then try to break the important $3.20 level. If the price closes above that zone, it could rise to $3.250 and maybe even $3.330. If the market stays positive, $XRP might even reach $3.40.

But if $XRP doesn’t break above $3.20, more selling could happen. The main support is at $3.080, and if it drops below $3.020, the price might fall toward $3.00. If that level also fails, strong support is expected near $2.980, where analysts think buyers might return.
What do analysts say about the $XRP price prediction?
Crypto strategist Lina Mercer said the bounce is important, but the momentum will only turn in favor of the bulls if $XRP closes above $3.20. Many in the market agree that if the price goes above $3.20, the short-term $XRP price prediction could move from neutral to slightly positive. Some analysts are more cautious.
A senior trader at Cryptowave Analytics explained, “We’re in a tight range. Unless $XRP moves above $3.250 or falls below $3.020, this might just be a choppy, sideways phase.” The coming sessions could play a key role in shaping the short-term $XRP price prediction.
Conclusion
Based on the latest research, $XRP price recovery is at a crucial stage, with traders closely watching the $3.20 resistance level. Many experts think that if $XRP breaks above this point, it could give bulls more control and lead the price toward $3.330 or even higher.
For now, the recovery still looks uncertain. Traders need to watch closely for any rejection near important levels, since the $XRP price prediction largely depends on whether the price can stay above $3.080.
Since the signals are still unclear and the market is volatile, the next price moves will be important in showing whether this is only a quick bounce or the beginning of a more strong upward trend.
Summary
$XRP price recovery is staying strong above $3.18, which is giving traders hope for a move toward $4 in 2025.The recovery began after $XRP found support at $3.080, but it’s still struggling to break past the $3.20 resistance. Technical signals are mixed, RSI is showing some improvement, but MACD remains in the bearish zone. The $XRP price prediction is staying cautious, as everything depends on holding support and moving higher.
Stay ahead with expert insights on $XRP-like price recoveries and bold 2025 forecasts on our platform.
FAQs
What resistance must $XRP break for a bullish move?
$3.20 is the critical resistance zone.
What happens if $XRP breaks above $3.20?
It could target $3.250, $3.330, or even $3.40.
Is $XRP above the 100-hourly moving average?
No, it’s still trading below that level.
What triggered the latest $XRP price recovery?
A rebound near the $3.080 support zone.
What price range are analysts watching?
Between $3.020 and $3.250 as the short-term range.
Could $XRP hit $4 in 2025?
Analysts see $4 as a possible 2025 target if momentum builds.
Glossary
Sideways Phase – A market with no clear upward or downward trend.
100-Hourly SMA – An average of $XRP’s last 100 hourly prices, showing trend direction.
$XRP – A digital asset used for fast, low-cost global payments.
RSI – A tool showing buying or selling strength.


