Ripple’s native token, XRP, experienced a significant drop alongside the broader crypto market today, dipping below the critical $2.70 level for the first time in two weeks. While this decline is noteworthy, analysts highlight that tightening Bollinger Bands on XRP’s daily chart suggest an impending major price movement.
XRP’s Impressive Three-Month Rally
As tracked by The Bit Journal, XRP has been one of the top-performing tokens in the market over the past three months, following the U.S. elections. Speculation surrounding its potential inclusion in the U.S. digital asset reserve has further fueled its price surge. From under $0.60 in early November, XRP skyrocketed to $3.40 by January.
This recent peak matched the all-time high XRP reached during the 2018 bull run. However, the token struggled to sustain this momentum and gradually lost ground over the following weeks. Over the weekend, XRP fell to $3.15 before tumbling to $2.66, marking a 15% intraday drop, before recovering to $2.80.
Ali Martinez Warns of Major Price Action
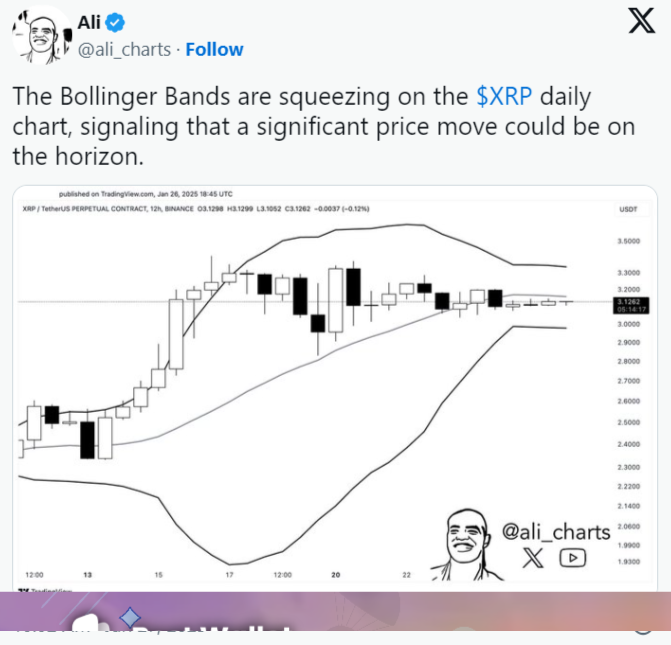
The broader market turbulence hasn’t spared XRP, with Bitcoin slipping below the $100,000 mark for the first time in weeks. On XRP’s daily chart, analyst Ali Martinez has observed Bollinger Bands narrowing, which historically indicates an imminent significant price movement. This contraction highlights heightened volatility in the coming days.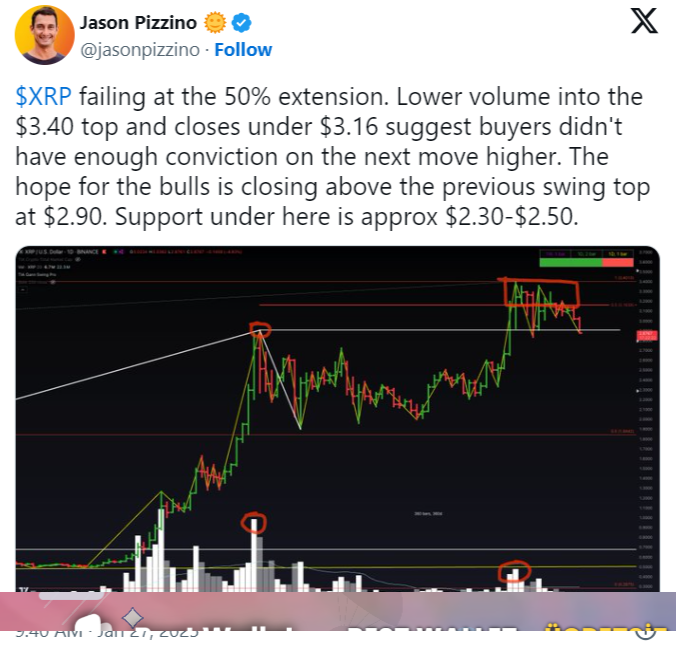
XRP Enters Critical Zone as Analysts Signal Incoming Volatility
Ripple’s XRP is standing at a technical crossroads, with its price sliding below $2.70 for the first time in two weeks amid broader crypto market volatility. According to experts, this dip may be a precursor to a large price movement, as tightening Bollinger Bands hint at a volatility surge.
While XRP has surged over 450% in the last three months, analysts caution that key support levels between $2.30 and $2.50 must hold to avoid further downside. Chart watchers like Ali Martinez and Jason Pizzino are closely monitoring daily closes for signals of trend reversals. Long-term traders remain hopeful due to XRP’s breakout from a 7-year triangle formation, but the next few days could define XRP’s short-term fate.
What Lies Ahead for XRP?
Crypto analyst Jason Pizzino has pinpointed key support levels for XRP at $2.30 and $2.50. He stressed the importance of a daily close above $2.90 to maintain bullish momentum and prevent further declines. “At this stage, the token is teetering near critical support zones,” Pizzino noted.
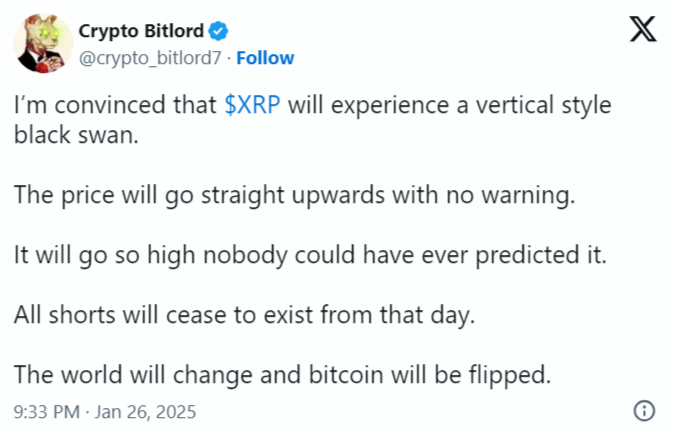
Despite the current volatility, most analysts remain optimistic about XRP’s long-term potential. Rob Art, a well-known crypto trader, highlighted that XRP recently broke out of a 7-year triangle pattern, indicating a likely continuation of its rally. However, he cautioned that this breakout might only materialize after shaking out emotional buyers and sellers. Art concluded, “Once this phase is over, XRP will turbocharge to higher levels.” Similarly, Crypto Bitlord predicted that XRP could experience a dramatic upward movement, describing it as a “black swan event” scenario.
Conclusion
As XRP hovers near critical levels, the token’s next move will likely depend on broader market conditions and key support zones. With analysts forecasting significant volatility, traders should keep a close watch on XRP’s daily performance. For the latest developments and expert insights, follow The Bit Journal.
Frequently Asked Questions (FAQs)
Q1: Why did XRP drop below $2.70 today?
The decline followed market-wide turbulence and profit-taking, pushing XRP below key support levels, although a slight recovery has since occurred.
Q2: What do tightening Bollinger Bands indicate for XRP?
They suggest a significant price movement is imminent—either a breakout or breakdown—based on historical volatility patterns.
Q3: What are XRP’s key support and resistance levels?
Support zones lie at $2.30 and $2.50. A daily close above $2.90 is essential to sustain bullish momentum.
Q4: Is XRP still in a long-term uptrend?
Yes. Analysts believe XRP’s breakout from a 7-year triangle pattern may support continued gains after short-term market corrections.
Q5: Could XRP experience a “black swan” price event?
Some experts, like Crypto Bitlord, believe XRP could spike unpredictably due to its historical pattern and emotional shakeouts.
Glossary of Key Terms
XRP – The native cryptocurrency of the Ripple network, designed for fast cross-border payments.
Bollinger Bands – A volatility indicator that shows potential price extremes. Tightening bands typically precede major moves.
Support Level – A price point where buying interest historically prevents further declines.
Resistance Level – A price point where selling interest typically prevents prices from rising further.
Triangle Pattern – A chart pattern that shows consolidation before a breakout. XRP’s 7-year triangle breakout is considered bullish.
Black Swan Event – A rare and unpredictable market event that causes dramatic price shifts.
- https://twitter.com/Thebitjournal_
- https://www.linkedin.com/company/the-bit-journal/
- https://t.me/thebitjournal
Follow us on Twitter and LinkedIn and join our Telegram channel to get instant updates on breaking news!


