XRP experienced heightened price turbulence as $105 million in long positions were liquidated, accelerating a sharp downward move. The token shed more than 8 percent within less than 24 hours, causing investors to panic and trigger stop losses. XRP Volatility intensified amid profit-taking, forced selling, and renewed concern over potential ETF delays.
XRP Volatility Surges as Liquidations Hit
XRP volatility surged as liquidations swept through the market, driving the price from $3.13 to a session low of $2.96. The abrupt price collapse occurred despite an early-session rally, which lost steam near resistance at $3.26. According to Coinglass, selling intensified when long positions worth over $105 million were liquidated.

The market could not stabilize, and the price rallied slightly to temporarily tag resistance before falling back below the price of $3.24. The liquidation tsunami came after the general loss in crypto as the market lost $18 billion in long and short positions. Analysts noted that liquidation-driven moves amplified XRP volatility, worsening the impact of routine profit-taking.
The price dropped once more to the level of $3.05 as the volume peaked at $6.2 million by 03:00 UTC, which is a sign of forced selling. Late-session recovery saw XRP close at $3.08, down 1.92% on the day. Nonetheless, not only were important supports maintained between $3.06 and $3.10, but they were challenged several times on the downside.
Resistance Caps Gains as ETF Concerns Grow
While XRP initially rallied in the session, institutional selling quickly capped gains near the $3.24–$3.26 range. The brief upside move was rejected at resistance, as traders offloaded holdings amid uncertainty around ETF approval timelines.
Nature’s Miracle announced a $20 million XRP treasury program, aiming to expand XRP adoption in sustainable agriculture solutions. Brazil’s VERT also revealed a $130 million blockchain deployment built on the XRP Ledger, targeting financial transparency. However, these bullish headlines failed to outweigh the drag from macro fears and institutional exits.
Despite the drop, XRP volatility remains driven by external catalysts such as ETF speculation and regulatory developments. Rumors about ETF delays caused an overall panic in the market and XRP incurred the wrath of this movement given its recent price sways. Profit pulling was increasing, particularly following the surge of XRP by more than 50% earlier this month.
Technical Indicators Suggest Temporary Pullback
XRP is above all high exponential moving averages, which means that the overall trend is still bullish despite recent losses. The 20-day EMA is $3.01 with longer-term averages of $2.67, $2.48 and $2.26 still as a cushion. Nevertheless, traders reported that the XRP volatility indicates disturbed trading sessions in the future.
The Relative Strength Index has moderated by posting a reading of 57.80 from the excessively overbought status, meaning that the previously bullish momentum is slowing down at the moment. Furthermore, the MACD indicator crossed over to negative, and a bearish crossover was created after the MACD line crossed beneath the signal line. These technical indicators indicate a short-term hold on consolidation.
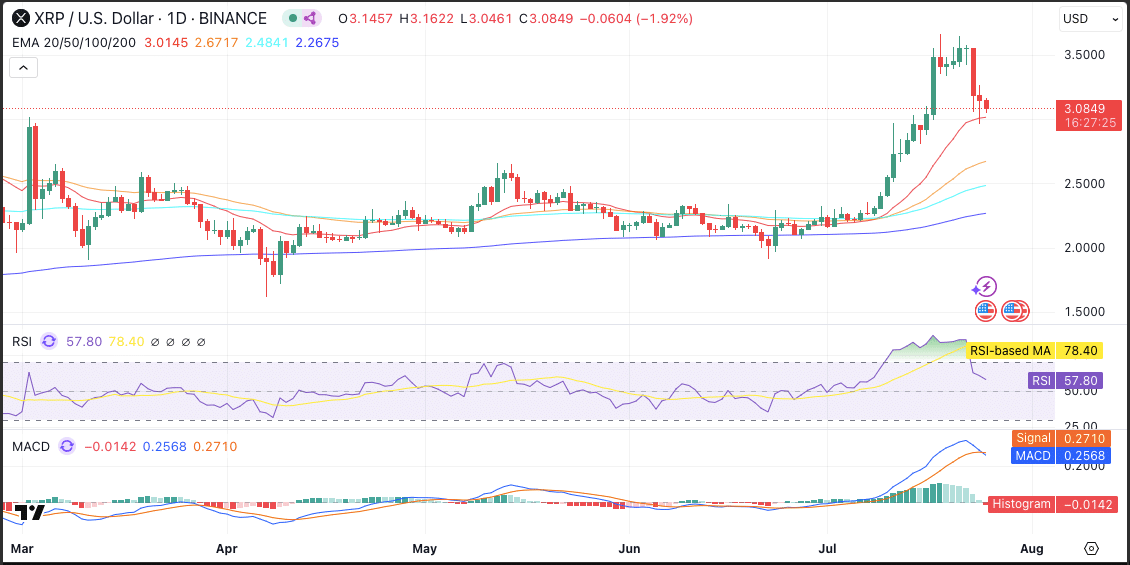
Nevertheless, XRP volatility accelerated partly due to abnormal trading volumes, which reached 175.94 million over twice the average. Such fighting nature and liquidation flows kept traders very cautious because downside spikes occurred unexpectedly and there was little to no strong news trigger. Such an attitude is consistent with the general chilling of the market in digital assets.
Also Read: $1 Trillion XRP? New ATH Rekindles $20 Target Debate
Summary
XRP experienced intense selling and there was a kind of strong volatility, and long positions were liquidated on the scale of $105 million within one day. A decline in prices was observed as it fell to $3.13 to $2.96 and then rose slightly to $3.08 where it maintained its key support. Strength met resistance at $3.26 and ETF worries coupled with institutional sell offs prevailed across the day.
FAQs
1. Why did XRP drop during the July 24–25 session?
XRP dropped due to over $105 million in long liquidations and growing fears of ETF approval delays.
2. What range did XRP trade within during the session?
XRP traded between $2.96 and $3.26, reflecting a 7.85% volatility spike over 24 hours.
3. Did any support levels hold during the price drop?
Yes, the $3.06–$3.10 support zone held firm despite repeated tests from sellers.
4. Were there any bullish developments for XRP?
Yes, Nature’s Miracle and VERT launched XRP-based projects worth $150 million combined, aiming to expand ecosystem utility.
5. What technical indicators suggest a pause in momentum?
The RSI dropped to 57.80 and MACD crossed bearish, suggesting a cooling phase amid reduced bullish strength.
Glossary of Key Terms
XRP Volatility: The measure of how rapidly XRP’s price changes within a specific time period.
Liquidation: Forced closure of positions, often due to margin requirements being unmet during sharp price moves.
EMA (Exponential Moving Average): A technical indicator used to assess price trends over various timeframes.
RSI (Relative Strength Index): A momentum oscillator that measures the speed and change of price movements.
MACD (Moving Average Convergence Divergence): A trend-following momentum indicator that shows the relationship between two moving averages.
ETF (Exchange-Traded Fund): A regulated financial instrument that tracks assets such as cryptocurrencies and is traded on stock exchanges.
Resistance: A price level where selling pressure typically prevents further upward movement.
Support: A price level where buying pressure typically prevents further downward movement.


