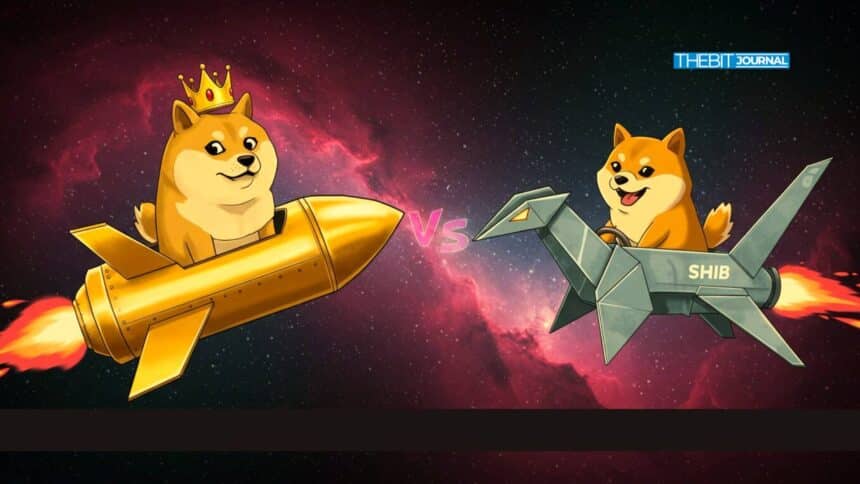
The July momentum in the crypto market has brought fresh attention to meme coins, especially Dogecoin (DOGE) and Shiba Inu (SHIB). Both have had big weekly gains, with DOGE up over 10% on high volume and SHIB steadily moving past resistance. Beneath the surface, these two tokens are telling different stories; one fueled by short-term hype, the other by measured technical structure.
For investors in this DOGE vs SHIB rally, the question isn’t which token is performing better; it’s which is better positioned for the next leg of the market.
Dogecoin’s Breakout is Speculative Firepower
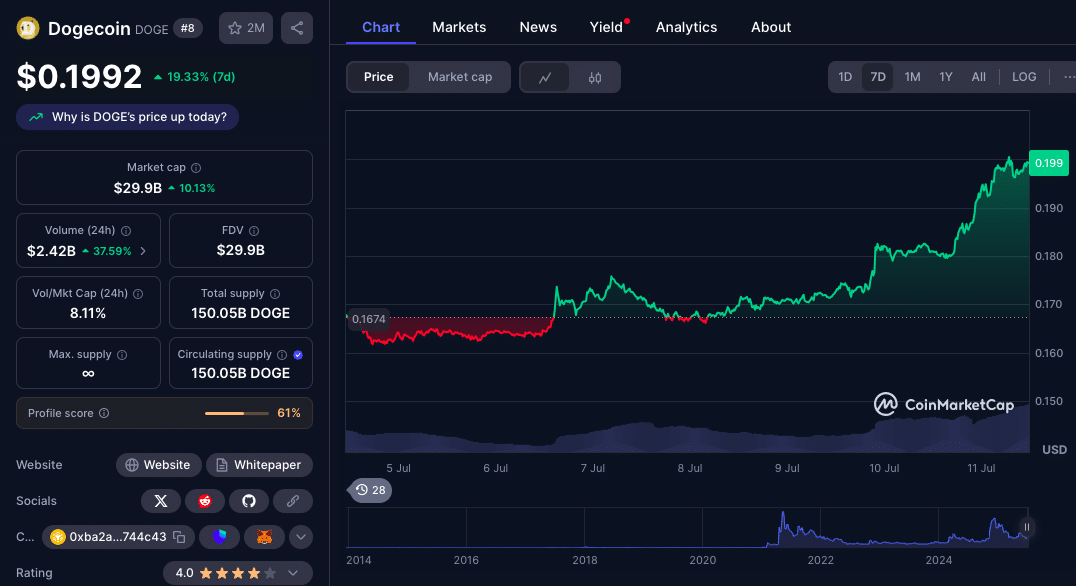
Dogecoin’s move from $0.180 to $0.199, powered by over 564 million in volume, is its typical volatile behavior. The breakout started around 16:00 on July 10, spiking above the average 24 hour volume of 334 million before stabilizing just below $0.200. In the final hour, DOGE cooled to $0.1984, a small pullback from its intraday high, indicating short-term exhaustion from profit taking, before moving back up.
This has rekindled the meme coin’s momentum driven behavior. However, with RSI divergence and resistance between $0.194 and $0.196, DOGE is between bullish conviction and a near term pullback. DOGE’s pattern of higher highs confirmed by volume; shows institutional activity but the technicals flash warning.
The support zone between $0.179 and $0.181 must hold for bulls to be in control. A sustained move above $0.200 could set up a move to $0.215 to $0.22 while any drop below $0.194 would invalidate the immediate bullish setup.
Shiba Inu’s Quiet Climb is Structural
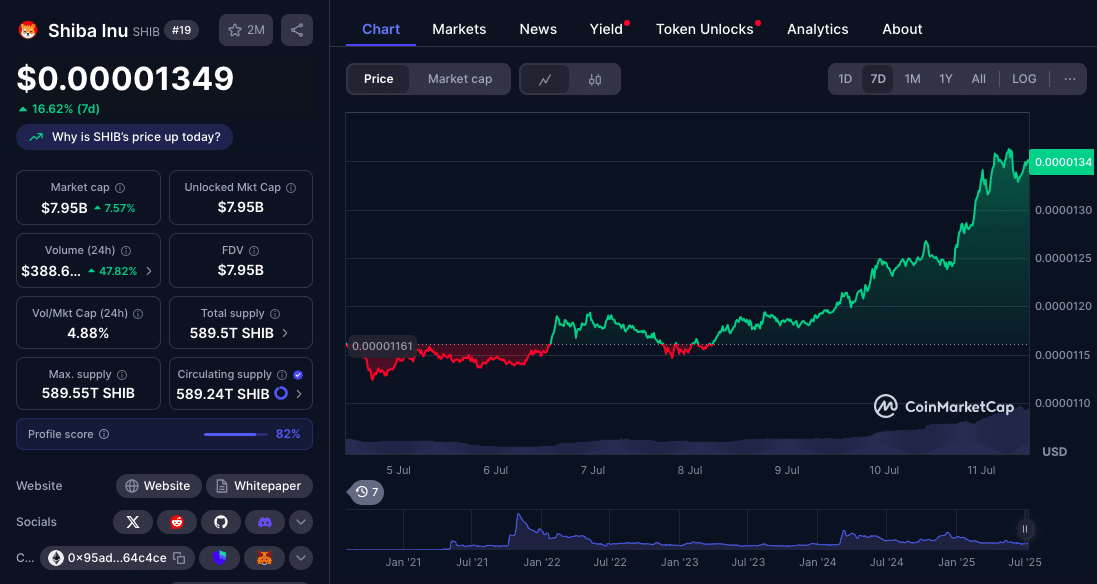
While DOGE made headlines with its 10% move, SHIB had a more subtle but arguably stronger move. Up 8% on the day and 13% on the week, SHIB’s price has moved above key moving averages with increasing volume but without the volatility of DOGE. SHIB’s BTC pair broke out 3.7% with 1.25 trillion in token volume, about 5x its recent average.
SHIB is in a triangle breakout above both its 50-day and 200-day moving averages. The slow build-up of momentum is accompanied by rising Fear and Greed indexes; this is a more organic, less speculative move. The focus is on the $0.000014-$0.000015 zone. Close above this and it could see $0.000016 and beyond.
Comparison Table: DOGE vs SHIB Outlook
| Metric | DOGE (Dogecoin) | SHIB (Shiba Inu) |
| Today’s Move | +10.3% breakout | +8% steady rise |
| Volume Insight | Surge to 564M vs 335M avg | 5× volume in breakout |
| Technical Levels | Support $0.179–0.181, resistance $0.195–$0.20 | Support $0.000012, resistance $0.000014–$0.000015 |
| Bull Scenario | Rally to $0.22–$0.23 | Surge to $0.000016–$0.000017 |
| Bear Scenario | Pullback to $0.18–$0.19 | Drop to $0.000011–$0.000012 |
Market Outlook: Which Way Will Meme Coin Momentum Go?
The meme coin rally is happening amidst broader crypto market bullishness. Bitcoin’s breakout to $118,000 and Ethereum’s $3,000 are creating the liquidity for altcoin flows. In previous times, such Bitcoin rallies are followed by capital rotation into riskier assets, including meme coins like DOGE and SHIB.
Not all meme coins behave the same. DOGE has historically led the meme market, due to its early-mover advantage and visibility (including Elon Musk’s tweets and memes). SHIB has matured into a more structured project with its own DeFi ecosystem and plans for SHIB: The Metaverse and Shibarium.
Expert Predictions for DOGE and SHIB
According to CoinCodex, Dogecoin’s technicals are bullish with over 25 green signals in the last 48 hours. They predict if DOGE holds, a 15% price increase by late July is possible.
Changelly analysts see SHIB’s structure as more sustainable. They predict SHIB to be around $0.000017 by late August 2025 if it holds above major support zones.
WalletInvestor has DOGE’s long-term at $0.28 by Q4 2025 and SHIB at $0.000021 under bullish conditions. But both platforms warn that the meme coin space is highly sentiment-driven.
Conclusion: Choose Your Meme Weapon Wisely
The DOGE vs SHIB meme coin rally is showing two paths. DOGE is explosive in the short term but requires constant monitoring due to volatility. SHIB is quieter but has a steady accumulation pattern supported by technicals and ecosystem development.
Investors must decide if they want to ride the rapid breakouts or slowly build into a long-term position. Either way, the meme coin battle between DOGE vs SHIB is more than just a popularity contest; it’s a tactical showdown.
Summary
DOGE and SHIB are leading the meme coin charge in July 2025 but their price actions are worlds apart. DOGE’s 10% breakout on high volume is short term volatility that could take it to $0.22. SHIB is up 8% weekly and forming a slower but technically sound move to $0.000016. Experts predict gains, but both tokens are highly sentiment-driven.
FAQs
Is Dogecoin better for the short term than Shiba Inu?
DOGE reacts more to market spikes so better for short term.
Can SHIB reach $0.00002 in 2025?
Analysts say SHIB could get to $0.00002 if current trend and support holds till Q4 2025.
Which has more long term potential between DOGE vs SHIB?
SHIB’s growing ecosystem and structured growth is good for long term.
What are the major resistance for DOGE vs SHIB?
DOGE has structural resistance at $0.200, SHIB has resistance between $0.000014 and $0.000015.
How do trading volumes affect meme coin prices?
High volumes like DOGE’s $564M recent volume often means momentum. But sustained interest is needed for long term gains.
Glossary
Meme Coin: A cryptocurrency inspired by internet jokes or pop culture, driven by community sentiment.
Volume Spike: A sudden increase in trading activity, means market interest or speculation.
Resistance Level: A price where selling pressure prevents further upmove.
Support Zone: A price where demand prevents further downmove.
Moving Averages (MAs): Technical indicators that smooths price data over time to identify trend direction.
Breakout: A strong price move above resistance or below support means trend continuation.
Sources


