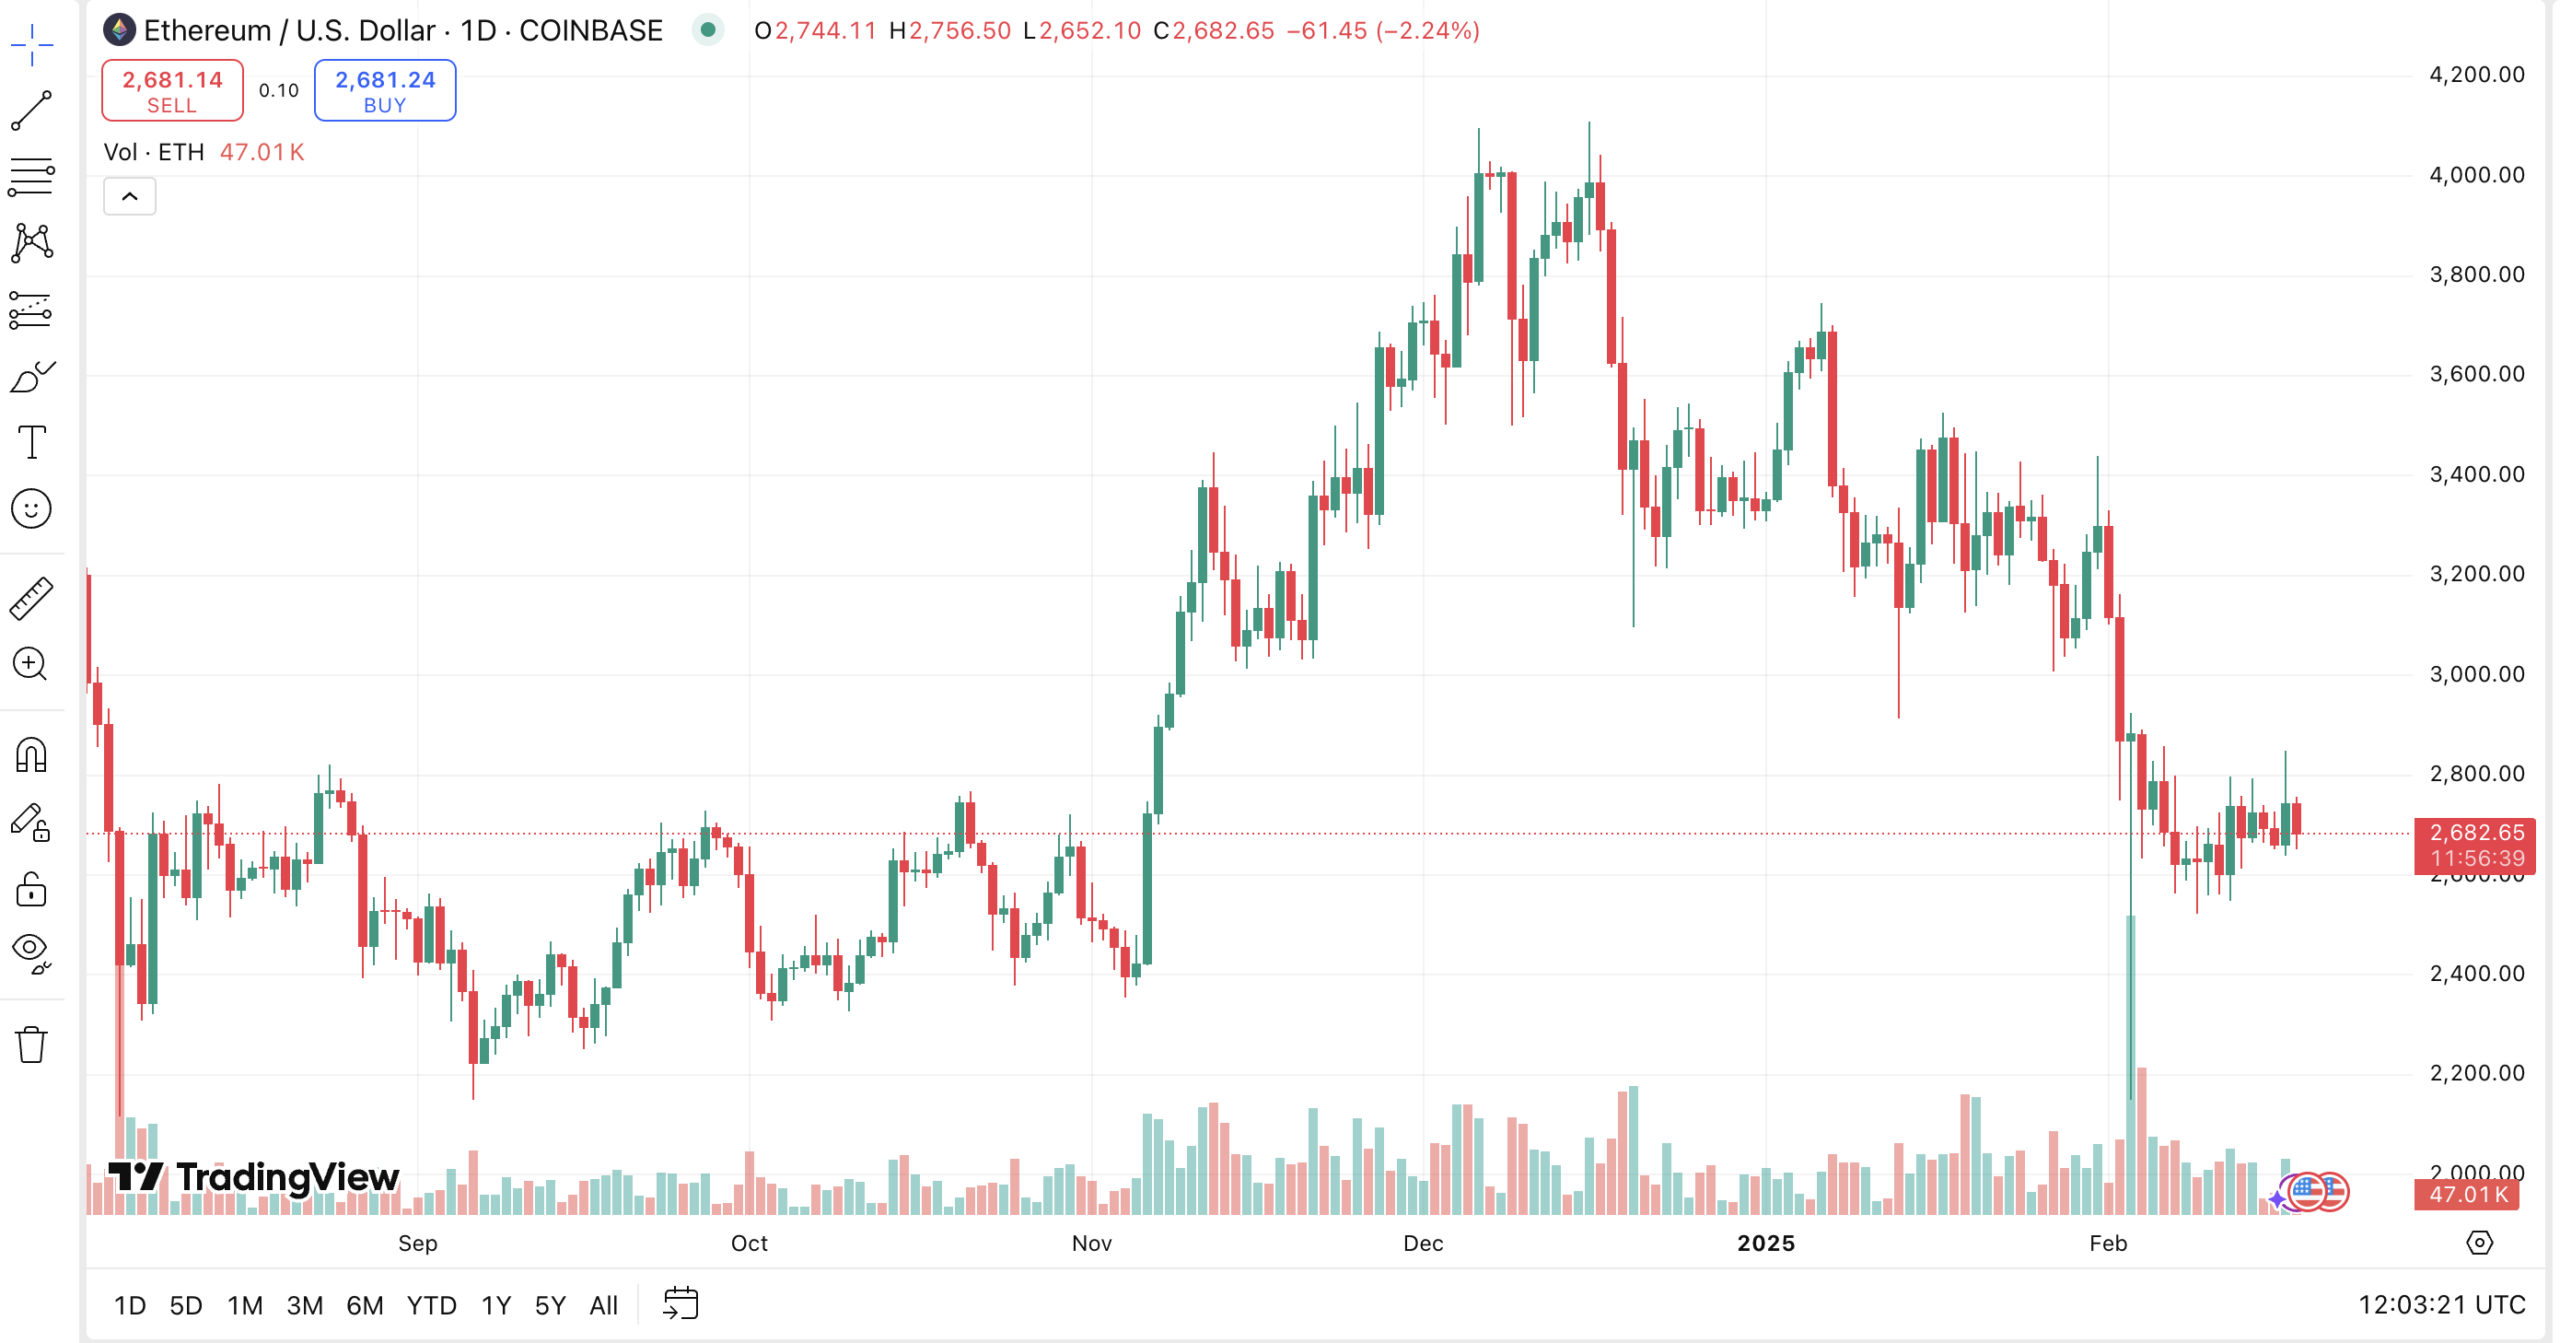
Based on available data, Ethereum (ETH) has faced volatile market conditions in recent weeks, with price fluctuations keeping traders on edge. The cryptocurrency has struggled to break through critical resistance levels, raising concerns about its ability to sustain a bullish breakout. Currently, ETH is hovering around $2,600, experiencing minor declines amid increased market uncertainty.
Despite signs of positive momentum, Ethereum’s resistance level at $2,870 has proven difficult to surpass. Investors are now questioning whether ETH can rally past $3,000 in the near term or if further corrections are expected. To examine technical indicators, historical trends, and key support and resistance levels to assess the potential for Ethereum’s next move.
Ethereum Faces Resistance: Key Technical Levels to Watch
Ethereum’s price action remains uncertain, with conflicting indicators suggesting both bullish and bearish scenarios. Here are the key resistance and support levels:
Resistance Level: $2,870 – A strong supply zone where ETH has repeatedly faced selling pressure.
Major Resistance: $3,272 – A break above this level could confirm a bullish uptrend.
Support Level: $2,530 – A critical area where ETH could stabilize in case of a downturn.
Major Support: $2,175 – If ETH falls below this, further losses could be expected.
These levels will play a crucial role in determining whether Ethereum’s price can sustain a bullish rally or continue facing downward pressure.

Ethereum Market Performance and Recent Trends
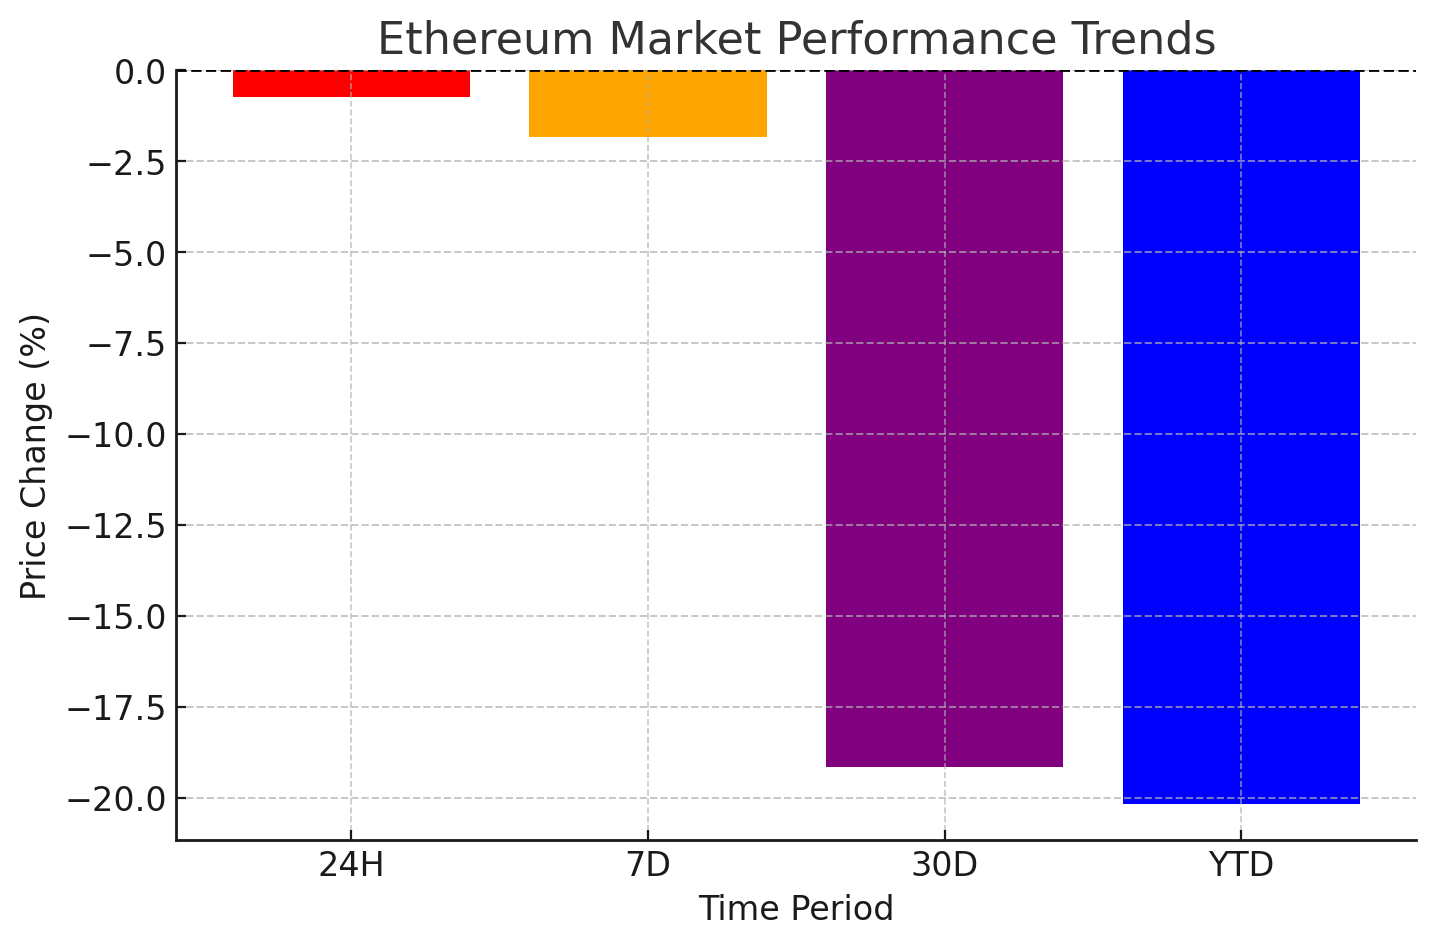
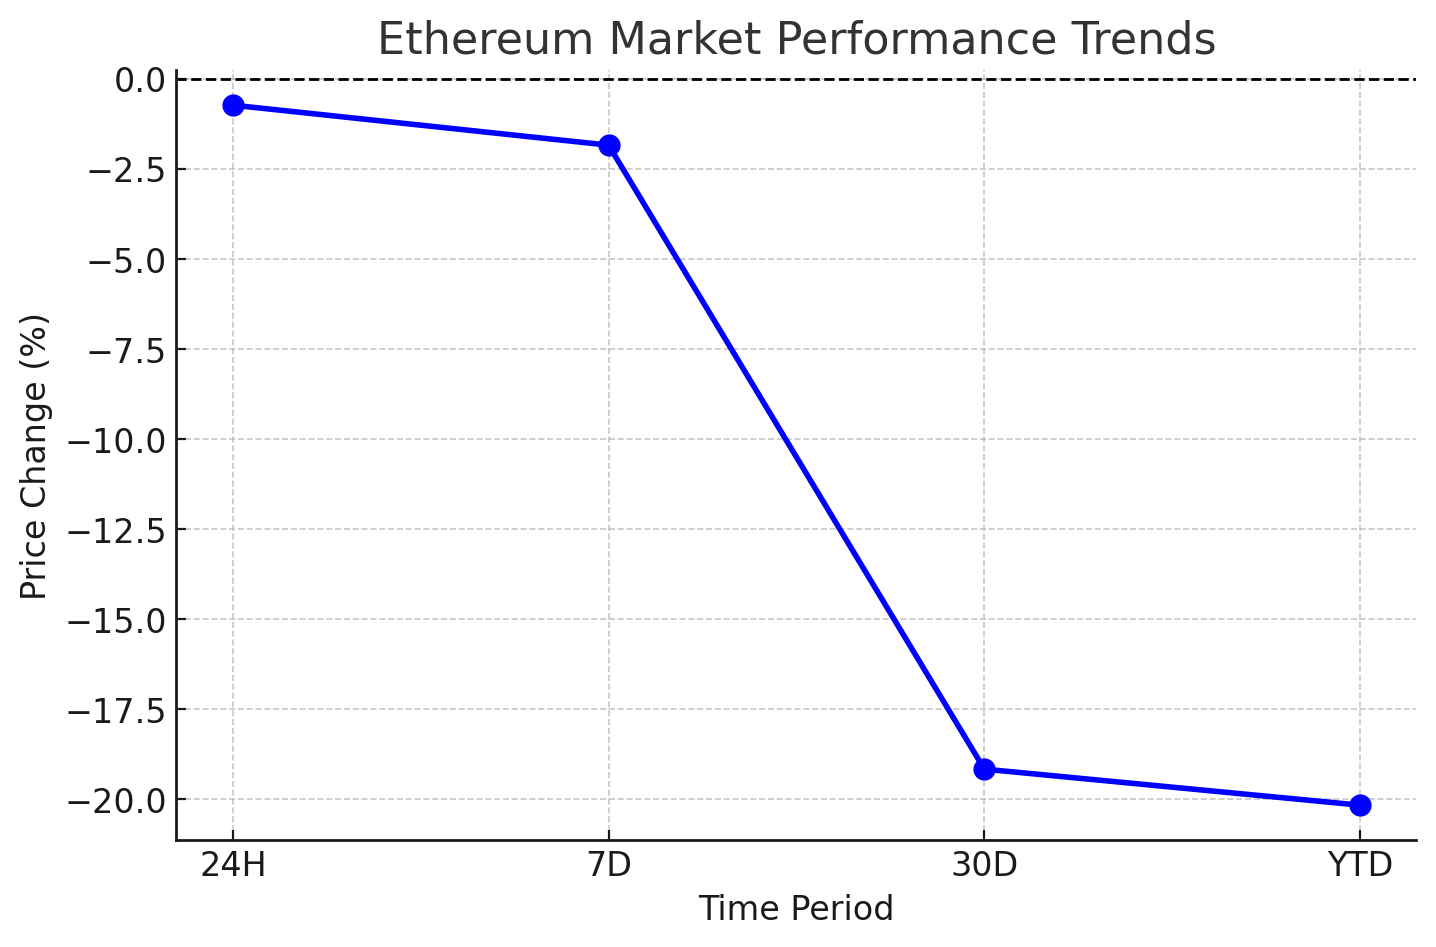
Ethereum has exhibited increased volatility, with notable price swings over the past few weeks:
- 24-Hour Price Change: Down 0.73%
- 7-Day Price Change: Down 1.84%
- 30-Day Price Change: Down 19.16%
- Year-to-Date (YTD) Return: Down 20.16%
Despite these losses, market analysts believe Ethereum’s long-term potential remains strong, especially with increasing institutional adoption and improvements in Ethereum’s Layer-2 scaling solutions.

Technical Analysis: What Indicators Reveal About ETH’s Next Move
Technical indicators provide valuable insights into Ethereum’s potential price trajectory:
Moving Average Convergence Divergence (MACD) – The MACD histogram shows rising green bars, suggesting a potential bullish shift.
Exponential Moving Averages (EMA 50/200-day) – The presence of a Death Cross signals heightened market uncertainty.
Relative Strength Index (RSI) – Currently at 38, indicating ETH is nearing oversold territory, which could trigger a rebound.
Fibonacci Retracement Levels – ETH is testing key retracement levels, which could serve as either support or resistance zones.
The combination of these indicators presents a mixed outlook, meaning traders should monitor market momentum closely.
Will Ethereum Reach $3,000 Soon?
Ethereum’s potential to reach $3,000 depends on a variety of market factors, technical indicators, and macroeconomic trends. If bullish momentum builds, Ethereum could break through its current resistance level of $2,870, paving the way for a rally toward $3,272 and beyond.
However, if bearish sentiment prevails, ETH could struggle to maintain upward momentum, with support levels at $2,530 and $2,175 being critical for price stability. Institutional interest, on-chain activity, and Bitcoin’s performance will also play key roles in determining Ethereum’s ability to surpass this psychological price barrier.

Ethereum’s ability to reach $3,000 will depend on market sentiment, investor activity, and broader crypto trends:
- Bullish Scenario: If ETH can establish strong support above $2,870, buyers may push the price toward $3,272, potentially setting the stage for a rally toward $3,500 or higher.
- Bearish Scenario: If Ethereum fails to break resistance, sustained selling pressure could drive prices down toward $2,530 or even lower to $2,175, where a critical support level exists.
Ethereum Price Predictions for 2025
Leading analysts provide price forecasts for Ethereum based on different market conditions:
| Year | Conservative Case | Base Case | Bull Case |
| 2025 | $2,500 | $3,800 | $5,500 |
| 2030 | $6,000 | $12,000 | $20,000 |
Market Sentiment and Ethereum’s Future
As Ethereum navigates a volatile market, industry experts are closely monitoring technical trends, institutional interest, and macroeconomic factors to assess its future trajectory. Analysts suggest that Ethereum’s long-term adoption, technological advancements, and DeFi expansion provide strong fundamentals. Below, leading market strategists share insights on how Ethereum’s price action might evolve in the coming months.
Industry experts weigh in on Ethereum’s potential price trajectory:
“Ethereum’s current price action reflects a consolidation phase. A break above $2,870 could trigger a strong rally, but failure to sustain momentum may lead to further corrections.” – Michael Carter, Crypto Market Strategist
While short-term uncertainty persists, many experts remain bullish on ETH’s potential, citing its increasing role in layer-2 scaling solutions and smart contract applications.
“Ethereum’s long-term fundamentals remain strong, with growing institutional adoption and Layer-2 development fueling optimism. Market sentiment will play a critical role in short-term price movements.” – Dr. Laura Bennett, Blockchain Researcher at DeFi Analytics
Conclusion: What’s Next for Ethereum?
Ethereum remains at a crucial price juncture, with $3,000 acting as a major resistance level. If ETH successfully breaks this barrier, it could signal the start of a new bullish phase. However, continued bearish pressure may lead to further corrections.
With growing institutional adoption, technological advancements, and market confidence in Ethereum’s potential, the long-term outlook remains positive. Investors should closely monitor technical indicators and market sentiment as ETH navigates through its next major price movement.
The BIT Journal is available around the clock, providing you with updated information about the state of the crypto world. Follow us on Twitter and LinkedIn, and join our Telegram channel.
FAQs
1. What is causing Ethereum’s price volatility?
Ethereum is experiencing price fluctuations due to uncertainty in crypto markets, regulatory developments, and macroeconomic trends.
2. Can Ethereum break $3,000 in the near future?
If bullish momentum builds, ETH could test $2,870 resistance and break above $3,000 in the coming weeks.
3. What are the major support and resistance levels?
ETH’s key support levels are $2,530 and $2,175, while major resistance stands at $2,870 and $3,272.
4. How does Ethereum compare to Bitcoin in terms of market growth?
Ethereum’s growth is driven by DeFi, smart contracts, and Layer-2 scaling solutions, whereas Bitcoin is primarily viewed as digital gold.
Glossary
Death Cross: A bearish technical indicator where the 50-day moving average crosses below the 200-day moving average.
MACD (Moving Average Convergence Divergence): A trend-following indicator that signals bullish or bearish momentum shifts.
Support Level: A price level where demand is strong enough to prevent further declines.
Resistance Level: A price level where selling pressure prevents further upward movement.
Layer-2 Scaling: Solutions built on top of Ethereum’s main blockchain to increase transaction speed and reduce costs.
References
Disclaimer
This article is for informational purposes only and does not constitute financial, investment, or legal advice. Readers should conduct independent research before making investment decisions.


