






This article was first published on The Bit Journal.
XRP price remained in focus after a recent jump, resting next to $1.4650, creating a short-term adjustment. Despite the pullback, the asset remained above its key support levels and 100-hour simple moving average, which left eyes on whether buyers can regain upside momentum.
The most recent structure indicates that the bulls remain active above 1.3850, where a support zone is forming in this scenario. However, weak follow-through and only a marginal increase in volume indicate that this market continues to remain at an impasse pending a clearer breakout.
XRP Price Clears Resistance but Faces Correction
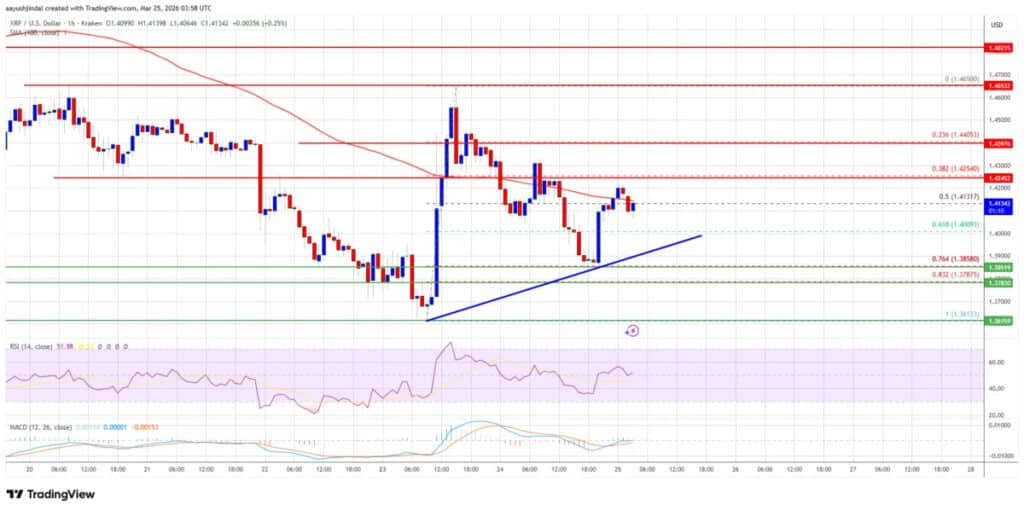
XRP price started the recent upward move after it broke the $1.4120 and $1.4250 resistance levels. The move then accelerated above $1.450 and gave evidence that buyers had even briefly seized control of the short-term trend.
The rally hit a local high of $1.4650 before the market reversed down. XRP price failed to continue higher and corrected lower below the $1.450 and $1.440 levels, performing less strongly for some of the earlier move.
The correction also dragged the asset below the 61.8% Fibonacci retracement level of the upward move from the $1.3612 swing low to the $1.4650 high. That often indicates that buyers are losing some steam, especially after an unsuccessful attempt to push higher.
The drop has not turned into a general collapse, however. Buyers took charge above $1.3850 and was able to defend the 76.4% Fibonacci retracement of the same move, allowing the XRP price to maintain an acceleration above a now technical base area.
Moving Average Keeps Bulls in Play
In the current setup, one of them is that the XRP price remains above the $1.40 level and also above the 100-hour simple moving average. That would imply the larger time frame short term structure remains unchanged despite the recent correction.
The chart also remains a series of higher lows, which are what you want to see when solidifying buying interest on weakness. That trend supports the theory that market participants continue to buy on dips, even if they haven’t yet produced a meaningful breakout.
Resistance Levels Stay in Focus
XRP price also had a decent increase above the $1.4000 resistance zone, but it struggled to gain momentum above the $1.4250 resistance. That level is currently a clear near-term barrier and will be with which the asset has to contend if it seeks to re-establish upside momentum.
The next significant resistance is seen around $1.440. A step back above that level would likely put the recent peak at $1.4650 back on the map and provide buyers another chance to take a shot at testing the top of the current range.
Upside Targets Above $1.4650
A confirmed break above $1.4650 will further bolster the short term bullish case. Should that happen, XRP price could see targets at the $1.50 resistance level which is also considered as a crucial psychological zone for traders.
A breakthrough above $1.5250 would pave the way for further gains towards $2.00, but we’d need sufficient buying support to keep prices afloat above 50 cents to lay that groundwork. Above that, the next technical barrier for bulls is around $1.550 where stronger selling pressure may enter.
| Month | Min. Price | Avg. Price | Max. Price | Change |
|---|---|---|---|---|
| Mar 2026 | $ 1.38 | $ 1.46 | $ 1.59 | 12.19% |
| Apr 2026 | $ 1.39 | $ 1.47 | $ 1.61 | 13.37% |
| May 2026 | $ 1.47 | $ 1.59 | $ 1.67 | 17.94% |
| Jun 2026 | $ 1.48 | $ 1.57 | $ 1.66 | 16.63% |
| Jul 2026 | $ 1.43 | $ 1.48 | $ 1.55 | 9.30% |
| Aug 2026 | $ 1.46 | $ 1.87 | $ 2.11 | 48.44% |
| Sep 2026 | $ 1.91 | $ 2.05 | $ 2.20 | 54.81% |
| Oct 2026 | $ 1.61 | $ 1.93 | $ 2.09 | 47.48% |
| Nov 2026 | $ 1.52 | $ 1.64 | $ 1.74 | 22.65% |
| Dec 2026 | $ 1.69 | $ 1.71 | $ 1.74 | 22.30% |
Risk of Another Drop Remains
The bullish outlook will flop if the XRP price fails to climb above the $1.4250 resistance zone. If that’s the case, then the asset may start another downward movement and test lower levels of support.
The next downside support is close to $1.40 and then the main one at 1.3850. If the market finishes below $1.3850, the decline may extend toward $1.3780 and then to the $1.3620 zone. Below that, the next support zones are close to $1.350 and $1.332.
Whale Activity Supports Accumulation View
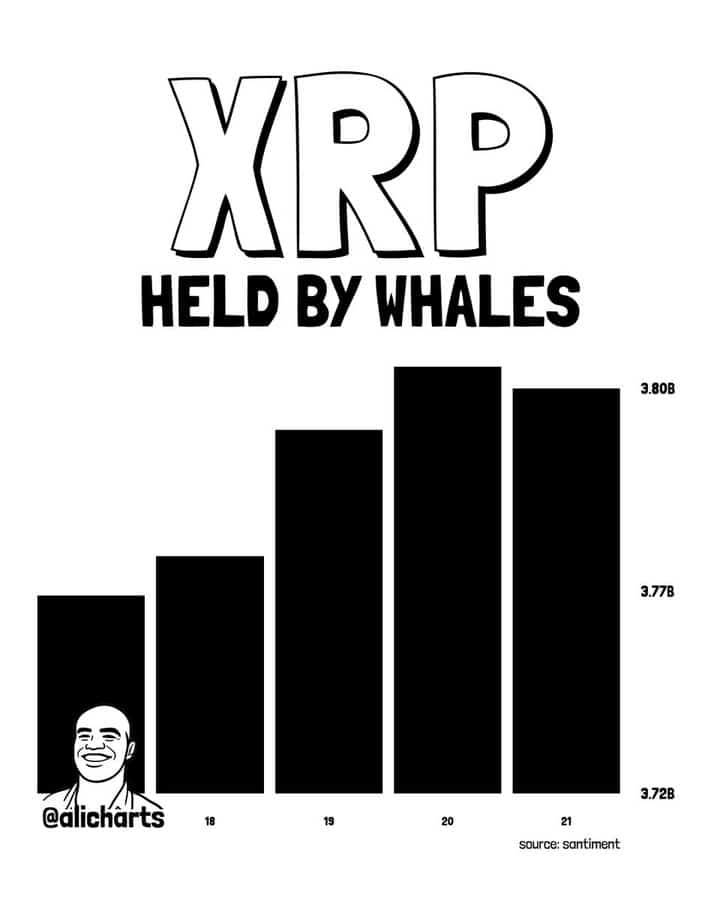
Attention in the market has also turned to on-chain activity, considering whale wallets have accumulated almost 40 million XRP within the last week. It points to accumulation in a period that XRP price was consolidating than trending strongly one way or another.
That kind of buying, which tends to occur during a break in the momentum, could indicate confidence among larger holders. Yet whale activity alone cannot prove that a breakout is near.
Macro Conditions Limit Conviction
Larger market sentiment is still closely connected to macroeconomic conditions, with crypto markets still responding cautiously to changing interest rate forecasts. This limits overall conviction, even when near-term technical structures look constructive.
Consequently, analysts should follow XRP price structure, and alts must also take signals from the externally initiated suggestion of a breakout apart from the resistance and support on the chart. That mix explains why momentum has remained subdued even as signs of buying interest have emerged.
Compression Setup Builds Tension
These are familiar occurrences, similar to a compression process whereby price compresses into an ever-more narrow range until some greater move occurs. It is the kind of pattern that traders tend to monitor closely because if support or resistance breaks they can lead to stronger volatility.
Volume has been a bit high but hasn’t reached the level to confirm breakout. As the current move stands without stronger participation, it is still a setup rather than a confirmed trend shift.
Technical Indicators Show Mild Improvement
The XRP/USD hourly MACD is losing bearish momentum in the zone. This could suggest that sellers may be easing a bit in the current range.
The XRP/USD hourly RSI is also above 50, indicating that momentum has shown slight improvement. Collectively these indicators point to stabilizing conditions, but not yet a fully confirmed bullish breakout.
Conclusion
XRP price continues to be stuck in a technically significant zone after the cryptocurrency rallied to $1.4650 and then corrected downwards. The main support range continues to be defended by buyers, while resistance levels are close enough for now to limit further upside.
Appendix Glossary of Key Terms
Resistance: A price level where buying pressure can stall additional losses.
Support: A price level at which buying interest may halt further price falls.
Fib Retracement A chart drawing tool that helps predict areas of support and resistance.
100-Hour SMA: A short-term moving average (SMA) that takes into account the last 100 hours of value data.
MACD: A tool that follows trend direction and strength.
Frequently Asked Questions About XRP Price
1- What are the main support levels for XRP price?
Key support levels are at $1.4000 and $1.3850.
2- What is the first resistance level to watch?
The initial resistance line is around $1.4250.
3- What happens if XRP price breaks above $1.4650?
A breakout above $1.4650 may lead to $1.50, then $1.5250 and perhaps $1.550.
4- What happens if XRP falls below $1.3850?
The price could decline toward $1.3780, $1.3620, $1.350, and possibly $1.3320.
References