






Bitcoin price analysis shows the cryptocurrency market regained momentum as easing geopolitical tensions between the United States and Iran improved investor sentiment across global financial markets. The latest recovery was largely driven by a broader shift toward risk assets after both countries paused military strikes for a second consecutive day, reducing immediate concerns over energy-driven inflation.
Bitcoin moved back above the $65,000 level while several major cryptocurrencies also advanced, though market breadth remained limited. The improvement in market sentiment also coincided with a sharp decline in oil prices, supporting cryptocurrencies alongside equities and other risk-sensitive assets.
What does Bitcoin price analysis reveal about the latest recovery?
Bitcoin price analysis indicates that improving macroeconomic conditions, rather than crypto-specific developments, have been a major driver of the latest rally. Bitcoin is currently trading around $65,358.71, up 1.55% over the past 24 hours, with a market capitalization of $1.31 trillion, also up 1.54%.
Its 24-hour trading volume has increased 27.64% to $17.42 billion, while the volume-to-market-cap ratio stands at 1.31%, indicating elevated trading activity relative to Bitcoin’s market size.
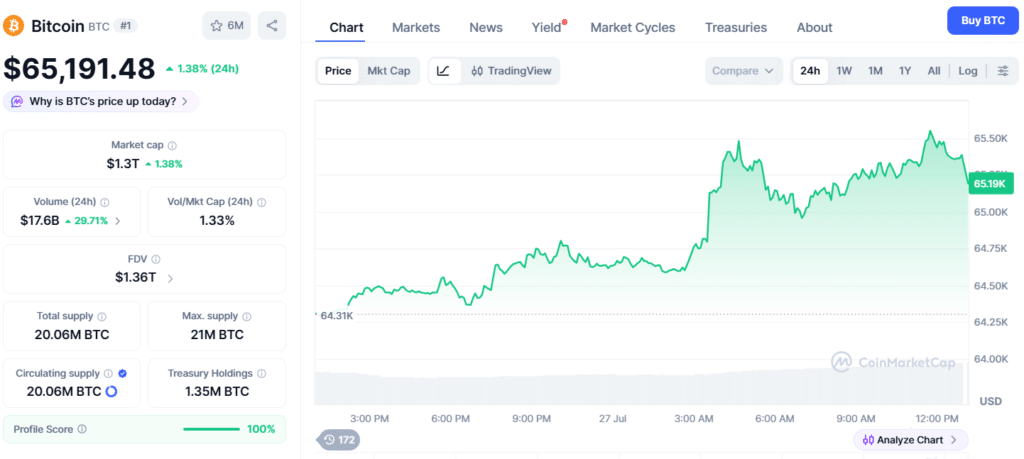
The broader cryptocurrency market also strengthened. Ethereum is currently trading around $1,969.01, gaining 4.56% over the past 24 hours. Solana is trading around $76.61 after rising 2.23%, while XRP is changing hands near $1.10 with a 0.98% gain. The recovery extended across several major cryptocurrencies, although Bitcoin continued leading the market, suggesting selective rotation into large-cap altcoins rather than a broad-based altcoin rally.
Why did easing geopolitical tensions support crypto markets?
The latest gains were largely driven by improving investor confidence after the United States and Iran paused military strikes for a second consecutive day. The conflict, which began in late February, entered a fragile ceasefire during the second quarter before hostilities resumed. Iran later stated it would continue halting airstrikes as long as the United States maintained the same approach, creating room for another diplomatic process.
Additional diplomatic discussions involving Oman focused on operational mechanisms for ensuring safe shipping through the Strait of Hormuz. These reported developments helped reduce concerns surrounding global energy supplies and inflation. Oil markets also reflected the improving sentiment. WTI futures traded around $85, roughly 5% lower, while Brent crude declined 4.7% to $92.19.
Light Crude Oil Futures were trading around $83.66, down 6.33%. Lower oil prices eased headline inflation concerns, reducing pressure on the Federal Reserve to tighten monetary policy aggressively. That improved liquidity expectations and encouraged investors to increase exposure to higher-risk assets, including cryptocurrencies.
How are macroeconomic trends influencing Bitcoin?
Bitcoin price analysis continues to show that macroeconomic developments remain an important influence on cryptocurrency prices. Nasdaq and S&P 500 futures traded about half a percent higher, while the Australian dollar and the euro strengthened against the U.S. dollar, reflecting improving risk appetite across financial markets.
Vikram Subburaj, CEO of India-based FIU-registered Giottus exchange, said in an email that broader macroeconomic developments were influencing market sentiment. “Prices are also responding to macro developments,” Subburaj said. He added that Brent crude’s decline had eased some inflation concerns, although the July 28-29 Federal Reserve meeting remains an important event for investors.
Markets are currently assigning a 36.3% probability to a 25-basis-point rate increase. While lower oil prices have improved sentiment, investors continue to monitor whether the diplomatic pause proves durable and whether monetary policy expectations shift following the Federal Reserve meeting.
What do technical indicators suggest about Bitcoin’s momentum?
Bitcoin price analysis points to steady momentum rather than an aggressive breakout, as technical indicators continue to send mixed signals. TradingView data places Bitcoin’s Relative Strength Index (RSI) at 55, showing that buying and selling pressure remains broadly balanced. The Average Directional Index (ADX) stands at 16, indicating that the current trend has yet to gain strong conviction despite the recent price recovery.
Other indicators paint a slightly more constructive picture. The MACD continues to flash a buy signal, while Bitcoin remains above its 50-day Simple Moving Average at $63,303, suggesting near-term price action is holding up. At the same time, the asset is still trading below its 200-day Simple Moving Average of $72,005, indicating that the longer-term trend has not fully shifted.
Market positioning also remains largely centred on Bitcoin. Its dominance, which measures Bitcoin’s share of the overall cryptocurrency market, has edged up to 58.6%. Ethereum accounts for 10.6% of the market, while the remaining cryptocurrencies collectively represent 30.7%, suggesting broader participation outside Bitcoin is still limited despite Ether’s stronger daily performance.
| Metrics | Current Level |
|---|---|
| Bitcoin (BTC) | $65,358.71 |
| Ethereum (ETH) | $1,969.01 |
| Solana (SOL) | $76.61 |
| XRP | $1.10 |
| Bitcoin Market Cap | $1.31 trillion |
| Bitcoin Dominance | 58.6% |
| Bitcoin RSI | 55 |
| Bitcoin 50-Day SMA | $63,303 |
| Bitcoin 200-Day SMA | $72,005 |
Why is Ether outperforming Bitcoin?
Ether outpaced Bitcoin during the latest recovery, although the broader market has not yet entered a widespread altcoin rally. Subburaj said Ether’s gain of more than 3% reflects some rotation into alternative cryptocurrencies. However, he also noted that Bitcoin’s 58.6% market dominance shows the move has not yet developed into a broad-based altcoin trend.
Ethereum is currently trading around $1,969.01 after gaining 4.56%, outperforming Bitcoin’s 1.55% daily increase. While trading activity has strengthened, single-session volume increases can also reflect short-term portfolio rotation rather than sustained long-term capital inflows.
Could Bitcoin be approaching another long-term cycle?
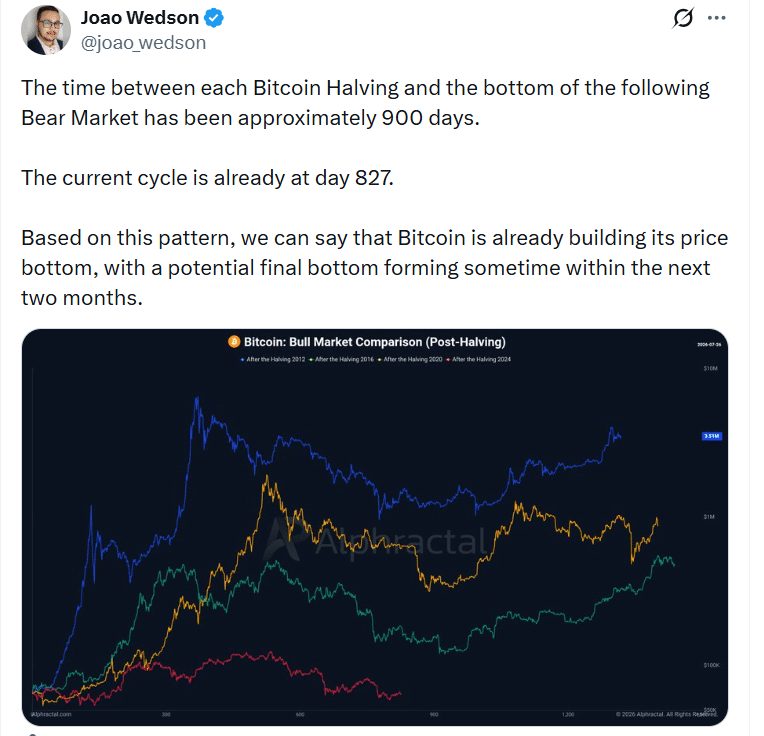
Some market participants continue monitoring Bitcoin’s historical four-year halving cycle for clues about longer-term price direction. Joao Wedson, founder and CEO of analytics firm Alphractal, said on X that previous market cycles suggest Bitcoin could be approaching the final stage of its current price bottom.

“The time between each Bitcoin Halving and the bottom of the following Bear Market has been approximately 900 days. The current cycle is already at day 827. Based on this pattern, we can say that Bitcoin is already building its price bottom, with a potential final bottom forming sometime within the next two months,” Wedson said. His assessment is based on historical market patterns rather than a confirmed prediction, and future price movements remain dependent on broader macroeconomic and geopolitical developments.
Conclusion
Bitcoin price analysis suggests that easing geopolitical tensions have provided short-term support for cryptocurrencies by reducing inflation concerns and improving overall market sentiment. Bitcoin’s recovery above $65,000 has been accompanied by stronger gains in Ethereum and higher trading activity, but Bitcoin’s 58.6% market dominance indicates that the broader market has not yet transitioned into a full altcoin rally.
The durability of the current recovery will largely depend on whether the pause in hostilities continues, how oil prices behave in the coming sessions, and whether the Federal Reserve’s policy outlook changes. Any renewed geopolitical escalation, a sharper rebound in energy prices or a more hawkish monetary policy stance could quickly alter risk appetite across global financial markets.
Glossary
RSI: Shows whether buying or selling pressure is stronger.
MACD: Signals possible changes in price direction.
ADX: Measures how strong a market trend is.
Bitcoin Dominance: Bitcoin’s share of the total crypto market.
Risk-On Sentiment: When investors prefer higher-risk investments for returns
Frequently Asked Questions About Bitcoin Price Analysis
How did the US-Iran ceasefire affect Bitcoin?
The ceasefire boosted risk appetite, helping Bitcoin and other cryptocurrencies move higher.
Why did Ethereum outperform Bitcoin?
Ethereum gained 4.56%, outpacing Bitcoin as investors increased exposure to large-cap altcoins.
What does Bitcoin’s RSI of 55 mean?
An RSI of 55 indicates Bitcoin has neutral price momentum.
Why did oil prices support Bitcoin?
Lower oil prices eased inflation concerns, improving demand for risk assets like Bitcoin.
Why is the Federal Reserve important for Bitcoin?
Fed interest rate decisions can influence liquidity and investor demand for cryptocurrencies.
Sources-