






Bitcoin price correction has become a key theme as investors assess whether the market is approaching a stronger valuation zone for fresh buying. The recent decline has attracted attention because the sell-off appears to be driven by measured profit-taking and leverage reduction rather than panic across the market.
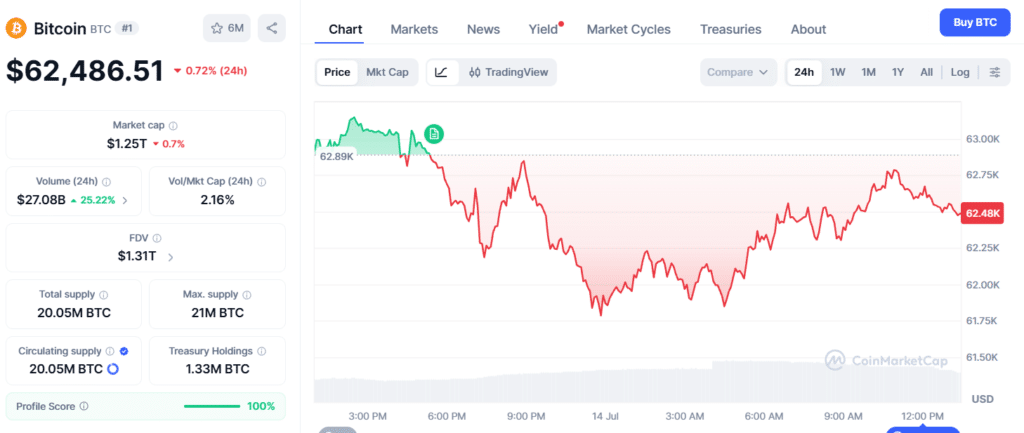
At the same time, several on-chain and derivatives indicators suggest that investors remain cautious and are holding back from deploying fresh capital. Bitcoin is currently trading around $62,508.23, down 0.46% over the past 24 hours after once again facing rejection near the $64.6K resistance level.
What Does Bitcoin Price Correction Indicate About the Current Market?
Bitcoin price correction reflects a period in which prices pull back after failing to sustain higher levels, allowing excess leverage to unwind while market sentiment resets. Bitcoin declined after another rejection at the $64.6K resistance zone, the same level that also capped gains about a week earlier. The move resulted in approximately $373.58 million in liquidations across the cryptocurrency market, including $107.32 million in Bitcoin long and short liquidations.
Despite the decline, market conditions do not yet resemble a full-scale bearish attack driven by aggressive short-selling. Recent market observations also point to a widening gap between derivatives activity and spot demand. While derivatives participation has remained elevated, spot buying has continued to lag, creating an imbalance that contributed to the latest correction.
If this combination of steady selling pressure and weak spot demand continues, analysts believe the market could gradually move toward a tipping point where downside volatility becomes more pronounced. Current market data shows Bitcoin holding a market capitalization of $1.25 trillion, while 24-hour trading volume has risen to $29.32 billion, reflecting heavier trading activity during the latest decline.
Why Are Analysts Calling This a Controlled Pullback?
The latest Bitcoin price correction has largely been linked to profit-taking instead of panic selling. A group of investors holding between 100 and 1,000 BTC sold around 67,000 Bitcoin on July 13. The selling represented a measured round of profit-taking rather than widespread fear across the market. Crypto analyst Axel Adler Jr. noted that Bitcoin’s Open Interest declined alongside price, but traders were not aggressively opening new short positions.
Instead, the data suggested that leveraged long positions were being closed, reflecting a reduction in market leverage rather than growing bearish conviction. The Bitcoin Perpetual Market Pressure Index also weakened during the decline. The indicator fell from 61 to 46 within just over 24 hours, dropping below its 30-day moving average of 58. This suggests buying pressure has weakened, and the index would need to reclaim its monthly average before buyers regain stronger control.
Coinglass data also shows leverage continuing to adjust. Total Bitcoin Open Interest currently stands at 755.79K BTC, valued at $47.33 billion. Open Interest changed by -0.08% over one hour, +0.24% over four hours and +2.26% during the last 24 hours. Bitcoin futures trading volume reached $52.06 billion, while nearly $65.95 million in futures positions were liquidated over the same period.
Why Is So Much Stablecoin Capital Still Sitting on the Sidelines?
The latest market structure suggests capital remains available, but investors are choosing caution over aggressive buying. CryptoQuant Insights analyst Moreno stated that the Bitcoin-to-Stablecoin Reserve Ratio on Binance has fallen to the lowest level recorded during the current market cycle. Binance currently holds around $43 billion in stablecoins, representing nearly 70% of stablecoin reserves across centralized exchanges, while accounting for only about 8% to 9% of exchange-held Bitcoin.
This creates a significant liquidity imbalance because substantial purchasing power is concentrated on an exchange with a comparatively limited Bitcoin supply. At the same time, total stablecoin reserves across exchanges have declined from roughly $76 billion to $61.6 billion. While this does not necessarily indicate an illiquid market, it means less capital is immediately available on exchanges to respond quickly to changing market conditions.
Moreno also cautioned that if stablecoin reserves continue to decline without being converted into spot Bitcoin purchases, the market’s visible liquidity cushion will keep shrinking, leaving prices more vulnerable to sharp moves during periods of stress. He added that investors remain defensive rather than aggressive, with many appearing willing to wait for deeper capitulation, wider discounts or stronger evidence that forced selling has been exhausted before rotating stablecoins into Bitcoin. This cautious stance may limit panic buying, but it also delays meaningful support if prices continue falling.
Could $42,429 Become the Next Major Accumulation Zone?
The Bitcoin price correction has also renewed attention on historical valuation models. The Bitcoin MVRV pricing bands measure whether Bitcoin is trading above or below the average investor’s realized cost basis. Historically, previous market cycles have often seen Bitcoin decline toward approximately 0.8 times the realized price before stronger recoveries developed. At present, that level stands at $42,429.
Analysts suggest some defensive investors may be waiting for prices closer to this valuation before deploying capital currently sitting in stablecoins. However, reaching that level would likely require a more significant market decline and could coincide with increased market stress, even if similar conditions have historically been followed by stronger recoveries.
Technical indicators continue to present mixed signals. TradingView data shows the Relative Strength Index (14) at 47, indicating neutral momentum. The MACD Level (12,26) continues to generate a Buy signal, while the Average Directional Index (14) remains neutral at 25. However, the 100-day Simple Moving Average at $70,613 and the 200-day Simple Moving Average at $73,620 continue to indicate Sell signals.
What Could Determine Bitcoin’s Next Move?
The direction of the Bitcoin price correction will likely depend on whether spot demand begins recovering alongside improving buying pressure. Recent market activity suggests the correction has primarily resulted from profit-taking and the closing of leveraged long positions rather than aggressive short-selling. Even so, persistent selling pressure combined with limited spot buying could keep the market under pressure if investors continue waiting for lower prices.

If spot demand fails to improve and stablecoin reserves continue to decline without being deployed into Bitcoin, the combination of thinning liquidity and ongoing selling pressure could leave the market more vulnerable to volatility and increase the possibility of a deeper pullback toward historically significant valuation levels.
Conclusion
Bitcoin price correction continues to reflect a market undergoing leverage reduction rather than panic-driven selling. The rejection near $64.6K, weaker buying pressure, declining Open Interest driven by long-position closures and defensive stablecoin positioning all indicate that investors remain cautious despite significant capital still being available. Historical valuation models identifying $42,429 as a potential accumulation zone explain why some investors may be waiting before entering the market.
Until spot demand strengthens and sidelined capital begins moving into Bitcoin, the Bitcoin price correction is likely to remain a defining market theme, while persistent weak demand and a shrinking liquidity cushion could increase the risk of prices moving closer to historically important valuation levels before a more durable recovery develops.
Glossary
Bitcoin Price Correction: A short-term drop in Bitcoin’s price.
MVRV Ratio: A metric that compares Bitcoin’s market and realized value.
Realized Price: The average price paid for all Bitcoin in circulation.
Accumulation Zone: A price range where investors tend to buy.
MACD: A trend indicator that shows buying or selling momentum.
Frequently Asked Questions About Bitcoin Price Correction
Why is Bitcoin’s price falling?
Bitcoin’s price is falling because of profit-taking, weaker spot demand, and lower market leverage.
How much was liquidated during the latest correction?
About $373.58 million in crypto positions were liquidated during the latest correction.
What is the possible Bitcoin accumulation zone?
Some analysts see $42,429 as a possible accumulation zone based on historical valuation models.
What could help Bitcoin recover?
Stronger spot buying and higher buying pressure could support a Bitcoin recovery.
What is the main risk if spot demand stays weak?
If spot demand remains weak, Bitcoin could face more price volatility and a deeper correction.
Sources