





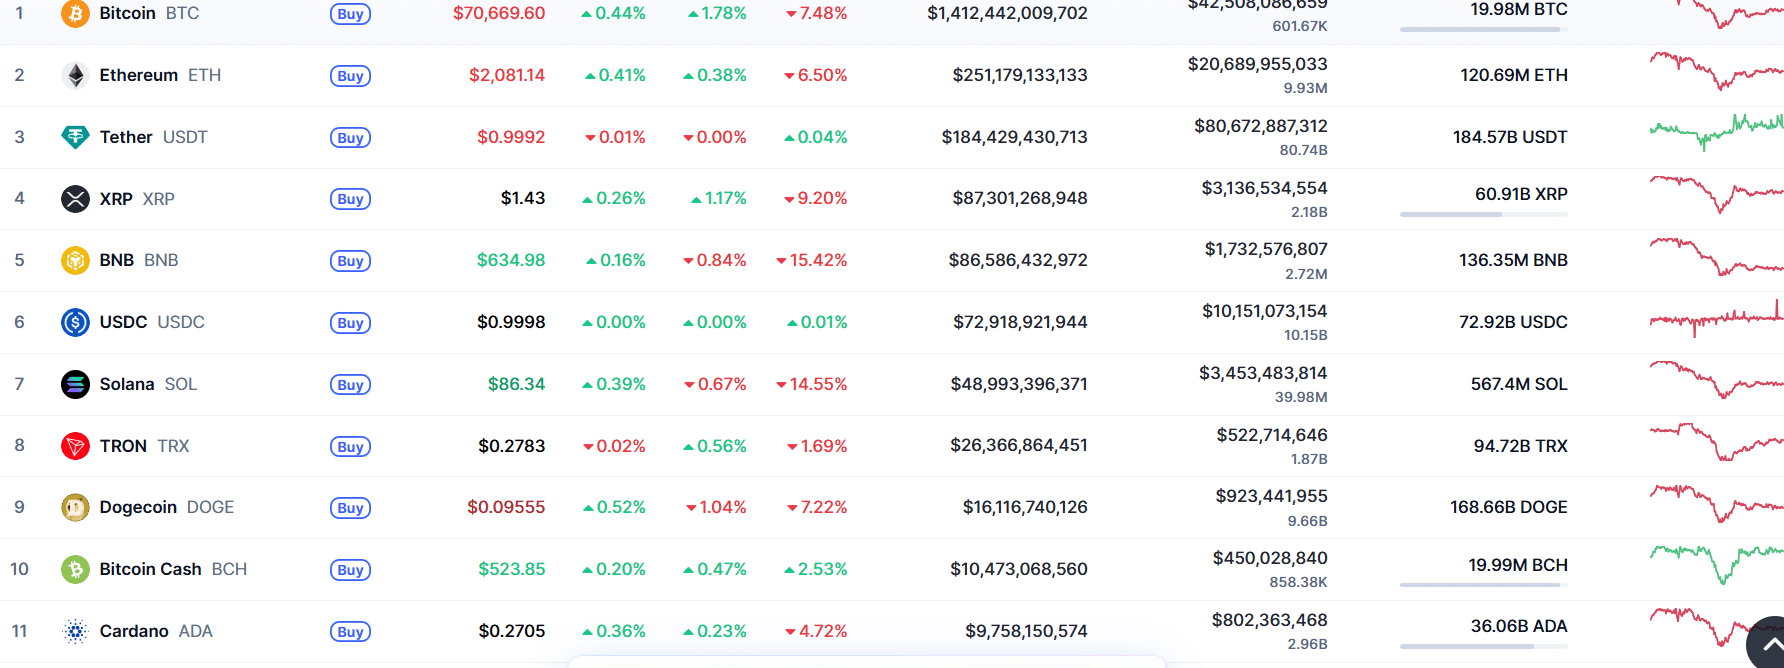
Markets have a way of punishing hesitation, and right now Cardano is living through that lesson in public. On February 9, 2026, ADA fell out of the top 10 cryptocurrencies by market capitalization after Bitcoin Cash pushed past it, ending a streak that had held since 2021.
That reshuffle was not the result of a slow drift. It came with a clear catalyst: Bitcoin Cash surged roughly 20% while ADA lagged, and the gap widened just enough to flip positions. At the time cited in the report, ADA sat near a $9.766B market cap, while Bitcoin Cash was around $10.43B.
For traders, this kind of ranking drop is not magical in itself, but it does matter. Index funds, watchlists, exchange front pages, and casual capital tend to orbit the top tier. Falling out of that orbit can dent visibility at the exact moment an asset needs fresh demand to stabilize.
Cardano price analysis: why the $0.22 area has become the whole conversation
The more uncomfortable detail is not the rank change. It is the price level. ADA has slid back into territory associated with the post FTX shock in November 2022, when it dipped below $0.22 and later revisited similar levels in early June 2023.
This is where Cardano price analysis becomes less about predictions and more about map reading. The $0.22 zone is widely treated as a historical inflection point. When price returns to a level that previously sparked strong reactions, the market tends to test it like a loose tooth, again and again, until it either holds firmly or finally gives way.
The same report notes that ADA has been in a bear market since early December 2024 and has traded below prior crash lows, despite intermittent market recoveries elsewhere. That context matters because it frames the recent move as part of a longer downtrend rather than a random wobble.
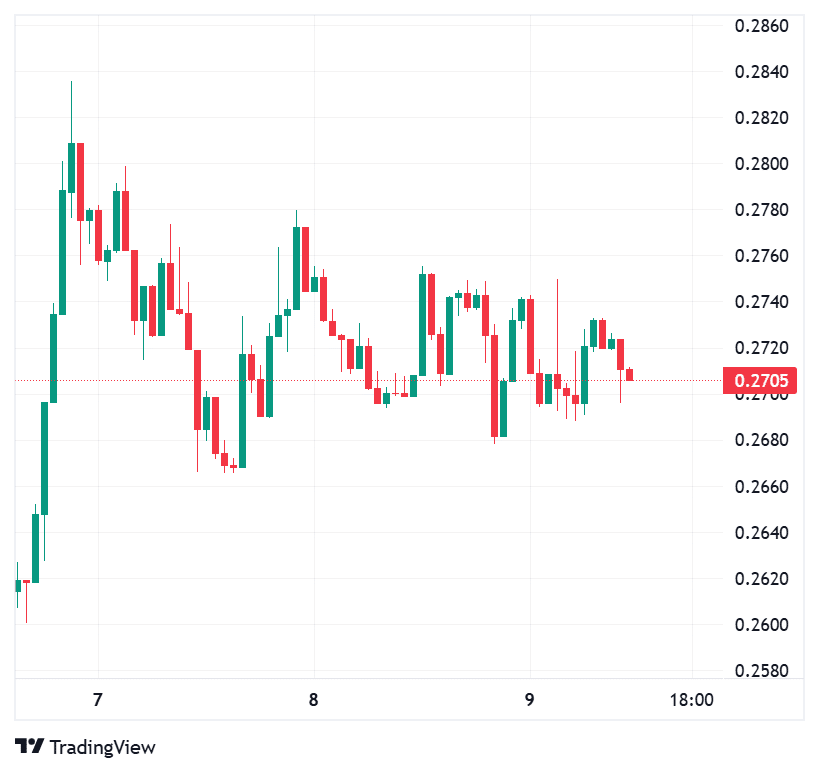
As a snapshot of where the market stood around the same day, multiple live trackers showed ADA trading around $0.27 and ranked outside the top 10, around the low teens by market cap. The exact rank can shift hour to hour, but the broader point holds: Cardano is no longer in the top tier by size, and the market has noticed.
Network activity sends a mixed message as the price weakens
When price falls hard, the easiest story is “everyone left.” Reality is usually messier. Transaction count, for example, did not follow price down in a straight line. The report highlights that transactions had fallen to about 168,100, then recovered to roughly 234,443 at the time of writing, even if still below older norms.
This is the kind of detail that changes how Cardano price analysis should be read. Rising activity during weak price can mean several things, and none of them are guaranteed bullish. It could reflect genuine usage, opportunistic repositioning, traders rotating on-chain, or even stress behavior as participants reshuffle wallets and collateral.
Still, it is a useful indicator because it challenges the simplest narrative. If the chain were truly emptying out, activity would usually shrink alongside price. When activity improves while price remains heavy, it often suggests the market is fighting a tug of war rather than surrendering outright.
The technical picture traders keep circling back to
Technical analysis is often mocked, usually by people who still check charts before they place an order. In ADA’s case, the technical framing is straightforward: a long downtrend, a major historical support area, and a market that wants proof before it trusts any bounce.
The report suggests the $0.22 zone could face another test and frames it as a potential reversal point based on prior behavior. In practical terms, traders typically watch three things around a level like this: whether sellers are still forcing lower lows, whether buy pressure shows up quickly on dips, and whether rebounds reclaim meaningful prior levels rather than producing weak, short-lived spikes.
This is where Cardano price analysis stops being abstract. A convincing recovery usually shows follow-through: higher highs, higher lows, and a gradual return of liquidity. A fragile bounce, by contrast, looks like relief, not strength.
The institutional angle: a fund increases ADA exposure into weakness
One of the more interesting signals is not on a candlestick chart. It is in portfolio weightings. The report points to a notable change in a smart contract-focused fund allocation, with ADA’s weighting rising from 18.50% to 19.55%.
On the fund’s own disclosures, the allocation list dated around early February 2026 shows ADA at 19.55% and provides a timestamp for those weights.
It is tempting to read this as a clean “smart money buys the dip” story. That can be true sometimes, and other times it is simply mechanical rebalancing based on market cap movements inside an index methodology. Either way, it adds texture. If a prominent product increases exposure while headlines are grim, it signals that at least one big allocation model is not treating ADA as uninvestable at these levels.
This matters for Cardano price analysis because sentiment often turns before price does, and positioning often shifts before sentiment becomes obvious.
What traders are likely watching next
At this stage, the market is not asking for poetry as it is asking for confirmation. The next move tends to hinge on whether ADA can defend the historical support zone discussed above, and whether rebounds show real demand rather than short covering.
If ADA holds and builds a base, the story becomes one of survival and gradual repair. If it breaks and fails to reclaim quickly, the market often searches for the next liquidity pocket lower, because traders hate uncertainty more than they hate bad news.
That is why Cardano price analysis right now is less about calling the bottom and more about tracking evidence: price reaction at key levels, activity trends, and whether broader market risk appetite returns.
Conclusion
Cardano’s drop out of the top 10 is the headline, but the deeper issue is the return to historically sensitive price territory tied to the post-FTX era. The on-chain activity rebound complicates the bearish narrative, while a higher ADA weighting in a major smart contract fund adds another layer to the picture.
In the near term, traders are likely to treat this as a “show me” market. If ADA stabilizes and begins reclaiming levels with strong participation, confidence can rebuild faster than people expect. If it fails, the market will not hesitate to mark it lower and move on. For now, Cardano price analysis points to a coin at a major decision point, with the next few confirmations likely to matter more than any single headline.
Frequently Asked Questions
What caused Cardano to lose its top 10 spot?
Bitcoin Cash gained sharply while ADA lagged, and the market cap gap widened enough to flip their positions.
Why is the $0.22 level important for ADA?
It is a historical zone tied to prior major selloffs and rebounds, making it a common level where traders expect a strong reaction.
Does rising transaction count mean price will recover?
Not necessarily. It can signal usage or repositioning, but price still needs sustained demand to confirm a trend change.
What does the fund allocation increase suggest?
It indicates ADA’s weighting rose from 18.50% to 19.55% in the cited fund data, which can reflect accumulation or index style rebalancing.
Glossary of key terms
Market capitalization: The value of a crypto asset calculated as price multiplied by circulating supply.
Support zone: A price area where buying interest has historically been strong enough to slow or stop declines.
Bear market: A prolonged period of falling prices, often accompanied by weak sentiment and lower risk appetite.
Transaction count: The number of transactions processed on a blockchain over a given period, often used as a rough activity proxy.
Rebalancing: A process where a fund adjusts holdings to match target weights or an index methodology.
Disclaimer:
This article is for informational purposes only and does not constitute investment advice. Digital assets are volatile, and anyone making financial decisions should conduct independent research and consider professional guidance.
Sources