






This article was first published on The Bit Journal.
Looking at the charts, after a good bounce from some key demand areas and bullish structures on its price structure, Ethereum (ETH) is definitely one to watch for next year in terms of a potential larger move.
Analysts are citing structural formations such as inverse head-and-shoulders on ETH/BTC charts, indicating potential upside and convergent technical, fundamental, and sentiment drivers that may wrap themselves around the Ethereum price forecast through 2026.
The Current Market Sentiment of ETH
As of December 2025, Ethereum is ranging between the low to mid $3,000s, considering volatility and consolidation patterns.
ETH’s price has been trading in the $3k range, while forecasted small gains are predicted to occur during the early portion of 2026.
Market sentiment indicators are mixed, with some models showing neutral RSI readings, while traditional technical analysis sell signals appear to be in the majority.
That said, wider macro drivers such as interest from institutions in crypto and its DeFi use cases are still shoring up the speculative demand surrounding Ethereum’s future potential.
Technical Breakdown: Indicators Point to Bullish 2026
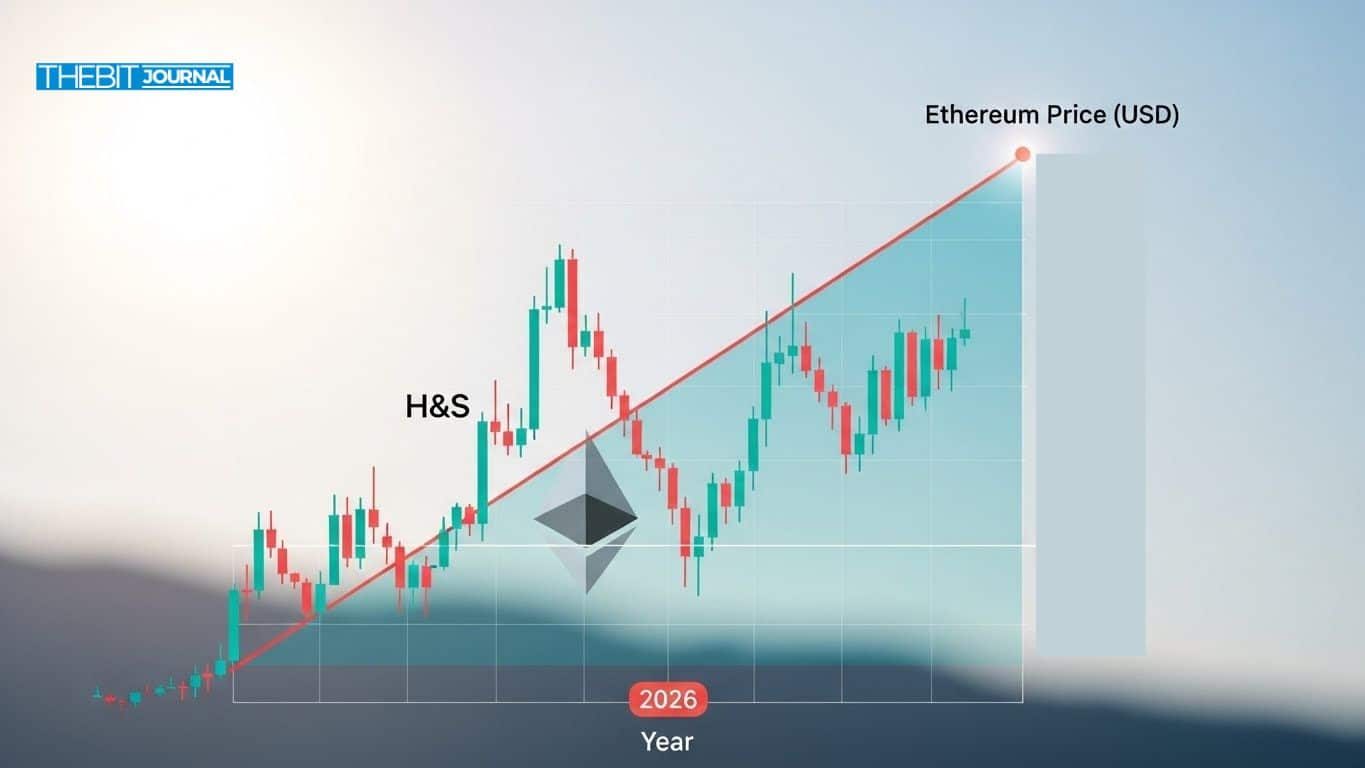
A pattern seems to be forming on high-timeframe ETH/BTC charts which is an inverse head and shoulders (IH&S).
Such a structure, created by strategically placed accumulation areas and robust support floors spotted in early 2024 and mid-2025, is often indicative of rising reversals after prolonged sell-offs.
Moving beyond that, markets expect to see $ETH run up by 80% relative to Bitcoin for 2026.
Expert Ethereum Price Forecast for 2026
The following table illustrates the forecasts of the latest Ethereum price forecast 2026 in comparison with various respected models and well-known specialists that are presently circulating in the market:
2026 Ethereum Price Forecast Table
| Source / Model | 2026 Target Range | Remarks |
| ChatGPT model forecast data | $5,376 (average) | AI-driven targets on price models for year-end 2026. |
| Grok prediction | $6,953 | High-end prediction from Grok model; implies significant upside. |
| Gemini forecast | $6,452 | Data from large language model Gemini. |
| Deepseek AI prediction | $5,735 | Model-based AI forecast for year-end. |
| Changelly | $3,486 (average) | More conservative range across years. |
| CoinCodex | $3,640 | Based on recent technical price ranges. |
These projections indicate a wide range of possibilities by 2026, from unified ranges around current values to several thousand dollars depending on the method or model assumptions.
Reasons Why Ethereum Price May Surge
Analysts point to a few drivers behind potential upside in 2026. One common denominator is the increasing institutional appetite for Ethereum-based products such as staking platforms and ETF inflows; factors that can impact demand and liquidity.

Recent staking activity from institutional validator growth also indicates deeper network commitment beyond retail participation.
Some estimates even note the role of $ETH beyond traditional smart contract use-case pointing to ecosystem activity and DeFi growth as building blocks that may play into price discovery if the macroeconomic factors become more optimistic.
Conclusion
Technical indicators, including an inverse head-and-shoulders pattern, indicate that Ethereum may outperform against Bitcoin and might see a strong upward momentum if a breakout of the critical levels occurs.
In the meantime, an array of professional targets ranging from stable trader models that are not much higher than current levels to high-end algorithmic projections that go well above $6,000 reflects the scope and complexity of market expectations in the year ahead.
Ultimately, Ethereum’s path in 2026 is determined by technical breakouts as well as institutional momentum and how wider crypto adoption evolves.
Glossary
Ethereum (ETH): The world’s second-biggest coin offers a smart contract platform for the development of decentralized applications (dapps).
IH&S: Known as an inverse head-and-shoulders or a reverse head-and-shoulders, this is a common pattern in which the price changes direction, from moving lower to moving higher.
Institutional Inflows: Money flowing into a market from professional investors of some kind (funds, business).
Average Price Target: The average price target from multiple analysts based on the same stock research report.
Frequently Asked Questions About Ethereum Price Forecast for 2026
What is Ethereum price forecast for 2026?
Projections vary wildly in the coming year, model-based projections ranged from about $3,500 to more than $6,900 by the end of 2026.
Do analysts believe $ETH is headed up in 2026?
There are numerous expert opinions and algorithmic forecasts pointing to the upside, though varying based on methodology.
Which technical pattern indicates a big move?
The ETH/BTC charts reflects an inverse head and shoulders pattern, suggesting potential bullish reversal with adequate confirmation from price action.
Which factors would allow ETH to go up?
Institutional demand, network expansion, on-chain activity and increasing adoption are some of the primary factors.
References
Cryptopolitan
CoinCentral
CryptoRank
Finance Magnates
CoinCodex
Changelly
Analytics Insight
coinarbitragebot