







Ethereum price prediction is leaning bullish as Ethereum has been posting some of the strongest gains currently, outperforming Bitcoin on both the price and capital flows front.
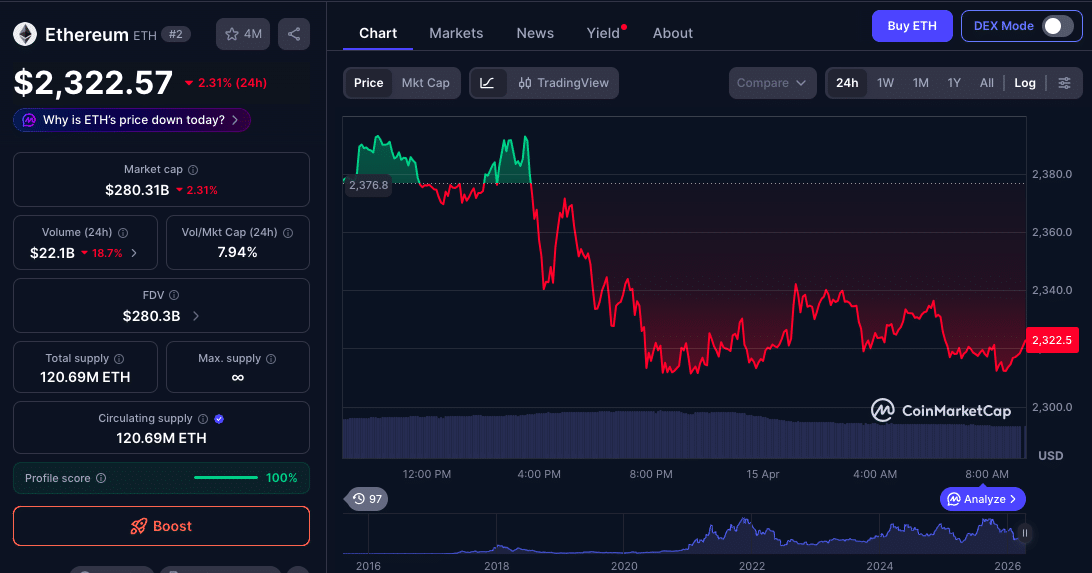
Following the latest data from the market, ETH had previously gained about 9% in the last 24 hours before retracing, touching towards a critical zone of resistance at $2,400.
Additionally, Bitcoin ETFs recently experienced $325.8 million in net outflows, whereas funds focused on Ethereum received a record weekly inflow of $187 million, the largest for 2026.
ETF Inflows and Institutional Rotation Drive Momentum
Institutional demand comes right in the center of this Ethereum price prediction. Spot Ethereum ETFs have continued to engage in steady inflow, and cumulative totals reached about $11.68 billion as of mid-April.
Data on daily inflows demonstrates the stability of this demand: April 9 saw $85.19 million; April 10 saw $64.95 million and April 13 still retained the continued positive inflows.
These figures prove that institutional capital is flowing in Ethereum, and it’s not just once but across series of sessions.
This is unlike Bitcoin, where large outflows on ETH has been a sign of profit-taking or repositioning. The result is a clear flow-driven rally where ETH benefits directly from capital leaving competing assets
On-Chain Activity Soars 41% But Poses Questions
On-chain data behind Ethereum price prediction shows a surge in network activity but at what cost? Ethereum transactions nearly doubled over a period of just one week recently; during which daily transactions reached 3.6 million; an increase of 41 percent from the previous week.
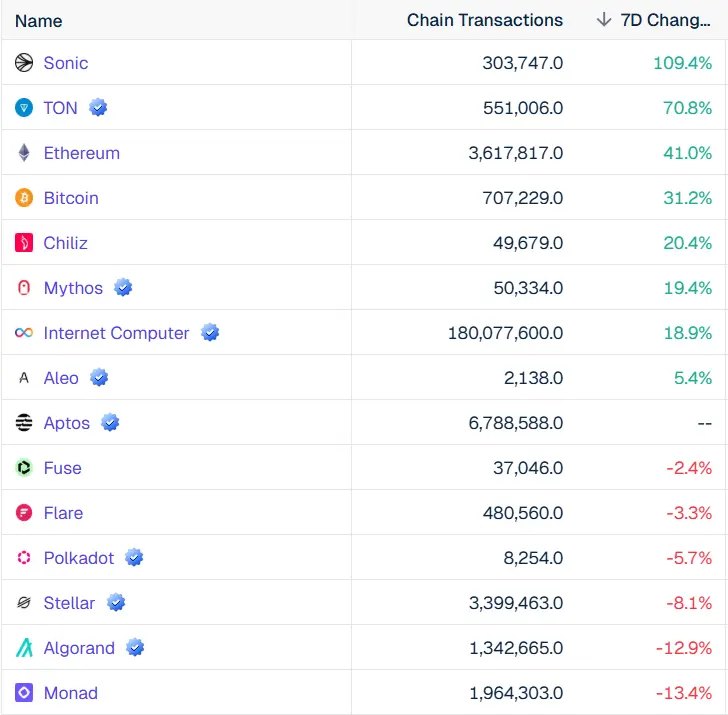
This increase reveals a widespread movement within the network and is consistent with the price momentum seen recently. However, a closer look at the data shows that during the same period; stablecoin transfer volume decreased by more than 40% and transaction fees declined significantly
This implies that while activity is rising, much of it may be low-value or speculative transactions rather than actual economic usage.
For the rally to continue, analysts say Ethereum is in need of a recovery in high-value transactions, not transaction counts alone.
$2,400 Resistance Becomes the Key Breakout Level
Now, the technical structure supporting Ethereum price prediction is all about one level which is $2,400. As at press time, ETH has moved way below this resistance zone, which has suppressed several recovery attempts over the past weeks.
Earlier, the technical chart had indicated the formation of an ascending triangle (as at press time, this has reversed), a pattern that is more often than not bullish continuation. If Ethereum has strong volume over this level, the next target could be at $3,000-$3,036.
That represents about 30% upside from present levels. On the flip side, failing to push through resistance could send ETH back towards $2,115 support zone or deeper into the $2,000s if momentum slows.
The next move entirely depends on what the price does at this resistance.
Expert Ethereum Price Predictions
| Source | 2026 Prediction | Insight |
| CoinCodex | $2,720 – $2,880 | Moderate growth, steady cycle expansion |
| Changelly | Avg $2,434, max $2,816 | Conservative near-term upside |
| Kraken Model | $2,319 – $2,409 | Slow growth scenario (5% annual model) |
| Capital.com (Analysts) | $3,000 – $5,000+ range | Institutional demand-driven upside |
| MEXC / Analyst Range | $3,500 – $10,000+ | Highly bullish scenario tied to upgrades |
Conclusion
Currently, there exist three strong pillars that support the Ethereum price prediction and these are institutional inflows through ETFs; rising on-chain activity and a bullish technical structure
However, the data carries an important warning. The surge in transactions has not yet resulted in higher economic throughput, so the rally’s durability remains uncertain.
In the meantime, Ethereum leads the market backed by capital rotation and an improving sentiment. The outcome will be decided at the $2,400 level.
Glossary
ETFs: Exchange-Traded Funds, funds that are traded on exchanges and track an asset
Resistance level: A price point where selling pressure kicks in.
Ascending Triangle: Bullish charting pattern with higher lows towards resistance.
On-chain Activity: Transactions and operations happening on a blockchain.
Stablecoin Volume: Amount of value transferred using stablecoins
Frequently Asked Questions About Ethereum Price Prediction
Why is Ethereum currently beating Bitcoin?
Because capital flocking out of Bitcoin ETFs and into Ethereum ETFs is driving up demand for ETH.
Why does $2,400 matter for Ethereum Price Prediction?
That is a crucial resistance point. ETH can rally towards $3,000 if it breaks out.
Are Ethereum ETF inflows increasing?
Yes, weekly inflows were $187 million, a peak thus far in 2026.
Is Ethereum’s network activity growing?
Yes, transactions rose 41% week-over-week to roughly 3.6 million a day.
Is the rally sustainable?
That remains the question, depending on whether increased transaction activity translates to real economic value.
References