






Last updated on, 19th July, 2026
The crypto market often reacts to war through the usual channels as Bitcoin may catch a safe-haven bid, traders may trim leverage, and volatility usually ripples across majors before settling into familiar patterns. This time, the story bent in a different direction.
As the US Iran conflict intensified and oil traders searched for around-the-clock exposure, one derivatives venue became a pressure valve for global macro nerves. That shift helped send Hyperliquid’s HYPE token into the top 10 by market capitalization, not simply because sentiment improved, but because trading activity on the platform itself surged at a pace that the market could not ignore.
Why the US Iran conflict sent traders toward Hyperliquid
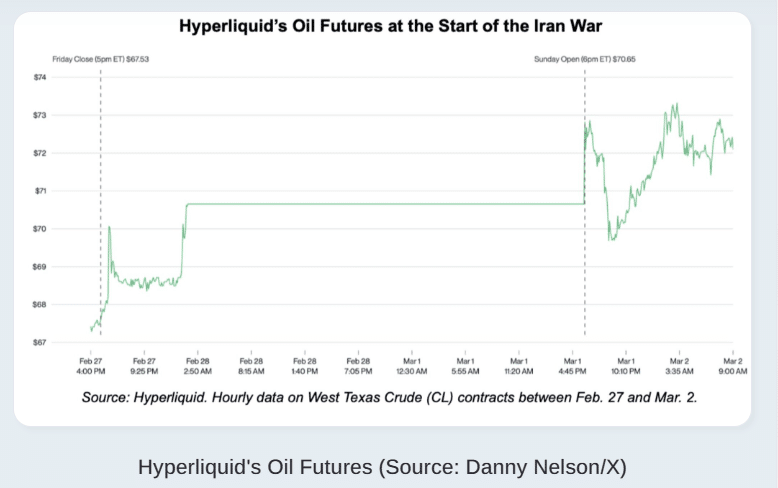
The core reason was simple, and it had little to do with marketing. During the US Iran conflict, traders wanted a market that remained open when traditional futures venues were closed, especially over the weekend. Hyperliquid offered that access, and oil became the standout instrument.
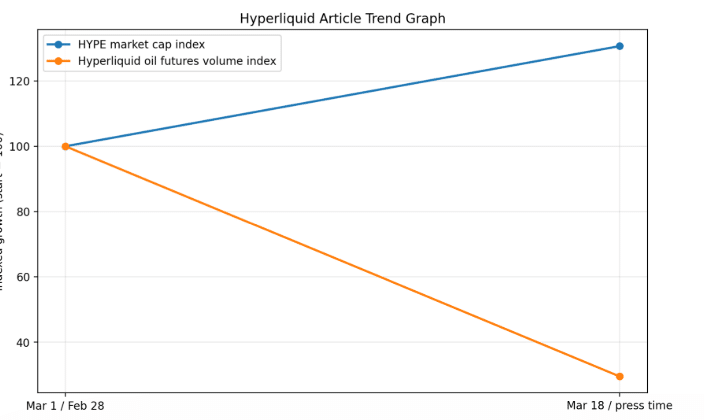
According to the reported figures, cumulative oil futures volume on the platform climbed from about $339 million on February 28 to more than $10 billion by March 18. That kind of jump was not routine speculation. It was a sign that traders were using crypto rails to express a macro view in real time.
That change in behavior mattered because the platform token sits close to the business itself. In plain terms, higher trading volume can translate into higher fees, and higher fees can reinforce demand for HYPE through the system’s buyback and burn structure.
So while many tokens rise on hope alone, this move had a more tangible backbone. The US Iran conflict created market stress, but the token responded because the exchange captured the traffic. That distinction is important. It separates narrative heat from actual cash flow.
The numbers behind HYPE’s breakout
By March 18, HYPE had reportedly climbed from roughly $8.16 billion in market value at the start of the month to about $10.66 billion, enough to overtake Cardano’s ADA and move into the top 10. That was a gain of around 30.7% in just over two weeks. In crypto, that kind of move can come from thin air for a day or two, but it usually does not hold without a reason. Here, the reason was volume, and the volume was tied directly to the US Iran conflict and the rush to price oil when legacy markets were not available.
The broader operating metrics support the story as recent protocol data shows Hyperliquid’s perpetual futures activity remained enormous, with roughly $187.47 billion in 30-day perp volume, $44.725 billion over 7 days, and $8.512 billion over 24 hours at the time of retrieval.
Fees and revenue also remained strong, with 30-day fees above $62 million and 30-day revenue above $55 million. Those are not decorative numbers. They are the sort of indicators traders watch when they want to know whether a token reflects a real engine underneath it.
Hyperliquid Captured Demand That Traditional Markets Could Not Serve
The oil surge highlighted a structural advantage rather than a one-off trading fad. Traditional crude futures follow fixed exchange sessions and may be unavailable for part of the weekend, while Hyperliquid’s on-chain perpetual markets operate continuously. During the March escalation, the platform reportedly processed about $1.2 billion in oil-linked volume in a single day as crude moved above $100 per barrel.
By May, oil products were still generating roughly $500 million in daily volume, suggesting that at least part of the demand continued after the initial geopolitical shock. Hyperliquid’s official documentation also states that trading fees are directed to community mechanisms, including liquidity providers, market deployers and the Assistance Fund. T
he fund automatically converts eligible trading fees into HYPE, creating a measurable connection between exchange usage and token demand. This does not guarantee that HYPE will rise whenever volume increases, since valuation, leverage, competition and circulating supply still matter, but it explains why traders treated the platform’s oil activity as more meaningful than a temporary headline-driven spike.
How Platform Activity Can Affect HYPE
| Platform indicator | What it measures | Why it matters for HYPE | Main limitation |
|---|---|---|---|
| Perpetual trading volume | The total value of derivative positions traded on Hyperliquid | Higher activity can generate more fees and demonstrate continued demand for the exchange | Large volume can be temporary and may be inflated by leverage or rapid position turnover |
| Oil-linked volume | Demand for crude oil exposure through the platform’s perpetual markets | Shows Hyperliquid expanding beyond crypto-native assets into round-the-clock macro trading | Activity may decline when geopolitical risk eases or traditional markets reopen |
| Protocol fees | Charges collected from completed trades | Part of the fee flow supports community mechanisms, including automated HYPE purchases by the Assistance Fund | Fee growth does not automatically justify any particular token valuation |
| Protocol revenue | The portion of economic activity retained by the protocol ecosystem | Helps investors compare token valuation with the platform’s underlying financial performance | Revenue can fall quickly when volatility and trading interest decline |
| Assistance Fund purchases | Automated conversion of eligible trading fees into HYPE | Creates recurring market demand linked to actual platform use | Buybacks may be outweighed by token unlocks, holder selling or weaker market sentiment |
| Open interest | The value of active derivative positions that remain unsettled | Rising open interest can show deeper participation and stronger trader commitment | Excessive open interest can increase liquidation risk during sharp price moves |
| Market diversity | The share of activity coming from crypto, commodities and other instruments | A broader product mix can reduce dependence on Bitcoin and altcoin trading cycles | New markets may have thinner liquidity and greater oracle or pricing risk |
| Token unlocks | The release of previously restricted HYPE into transferable supply | Unlocks test whether fee-driven demand is strong enough to absorb additional tokens | Scheduled supply does not prove recipients will sell immediately |
Because the article was last updated on July 19, 2026, the reference to an upcoming April 6, 2026 unlock should be removed or rewritten. April 6 has already passed, and available vesting trackers indicate that HYPE has followed a recurring contributor-release schedule rather than a single future April event. The more relevant analysis is whether future releases, including the next scheduled tranche reported for August 2026, are large enough to exceed demand generated through fees and Assistance Fund purchases.
What crypto investors should watch next
First is trading volume, because elevated activity suggests the platform is still capturing demand generated during the US Iran conflict. Second is revenue, which helps show whether that activity is translating into value for the ecosystem rather than passing through as noise. Third is market cap ranking, because a top 10 position tends to attract a fresh wave of attention, liquidity, and comparison trades. Fourth is token supply pressure, which remains the risk that could cool the rally if enthusiasm fades.
Token vesting data points to another HYPE unlock scheduled for April 6, 2026. Unlocks are not always bearish, but they do create a moment when the market has to absorb additional supply. If fee generation remains healthy, that supply can be digested. If volumes soften after the US Iran conflict loses urgency, unlock pressure may matter more. That is where traders need to keep their feet on the ground. A revenue-backed token can still stumble when supply arrives faster than demand.
Recent reporting and platform-related analysis have highlighted the Assistance Fund mechanism, which has been tied to open-market HYPE purchases and broader discussions around permanently removing those tokens from effective circulation.
That mechanism has helped shape the bullish case because it links platform activity with token economics in a way many exchanges only talk about. Still, no mechanism turns risk off. The market continues to remember prior stress events and remains sensitive to liquidation design, leverage behavior, and execution quality during fast markets.
Conclusion
HYPE’s rise into the top 10 was not a random sprint, and it was not just another flashy altcoin move. The US Iran conflict pushed traders toward a market that stayed open when others did not, oil volume exploded, and Hyperliquid benefited from being in the right place at the right moment.
That traffic then fed into the token’s economic story through fees, revenue, and burn-linked expectations. For now, the US Iran conflict has shown something bigger than one token rally. It has shown that crypto infrastructure is increasingly being used as a live macro trading venue, not only as a playground for digital assets.
FAQs
Why did HYPE rise during the recent market tension?
It rose because traders used Hyperliquid to gain nonstop exposure to oil and other risk markets during the US Iran conflict, which boosted platform activity and strengthened the token’s revenue narrative.
What indicators matter most for HYPE now?
The key indicators are perp volume, fee revenue, market cap ranking, and token unlock pressure.
Is the rally only about geopolitics?
No, the US Iran conflict acted as the catalyst, but the token’s move also reflected exchange usage, fee generation, and supply mechanics.
Glossary of Key Terms
Market capitalization
The total value of a token’s circulating supply at the current price.
Perpetual futures
Derivative contracts with no expiry that let traders speculate on price moves with leverage.
Revenue
The income a protocol keeps after activity on the platform generates fees.
Token unlock
A scheduled release of previously locked tokens into circulation.
Burn
The permanent removal of tokens from effective supply, which can support scarcity over time.
Oil volatility
Sharp price movement in crude oil markets, often driven by geopolitical stress.
Sources
Disclaimer
This article is for informational purposes only and does not constitute financial advice, investment advice, or a recommendation to buy or sell any asset.