






SHIB whales are back in motion
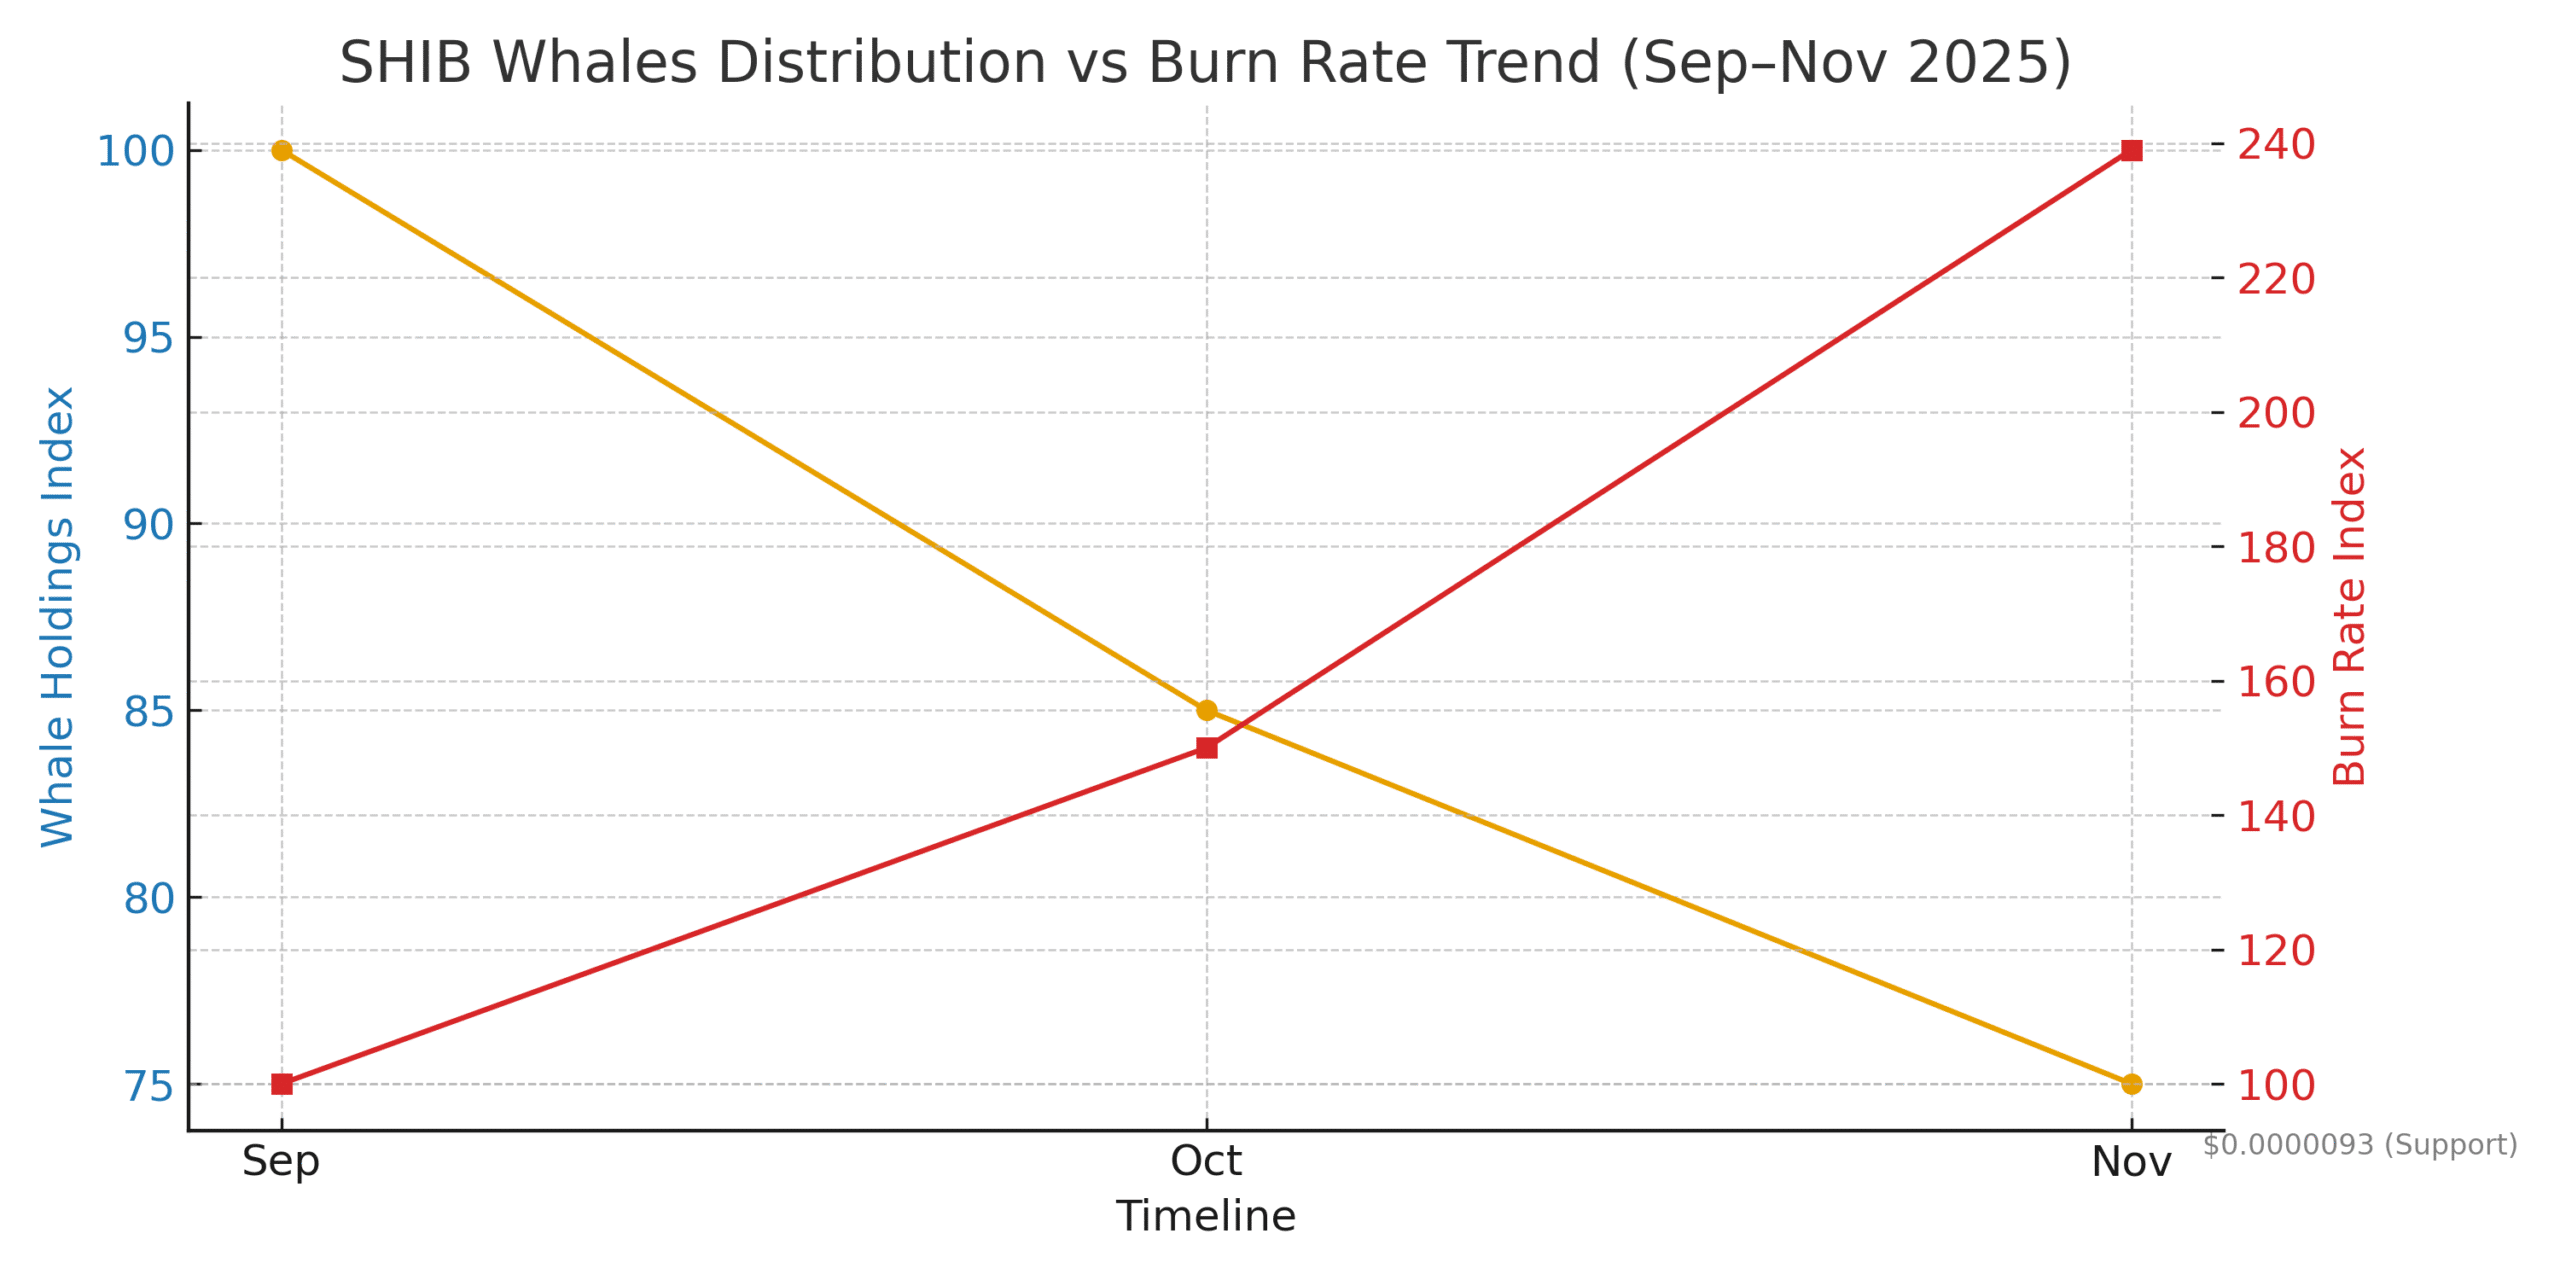
Markets rarely move in straight lines, and Shiba Inu is proving that again. Over recent weeks, SHIB whales reduced exposure while price coiled inside a narrow band. The story here is simple to read and hard to trade. Distribution has weighed on sentiment, and the chart keeps nudging traders to respect support and resistance first, opinions second. Data shows the largest holders have been cutting their share since early September, with sharp bursts of selling after 10 October, a backdrop that has capped rebounds.
The selling pressure overlaps with a steady pickup in older tokens moving again. Dormant circulation spiked on 19 October and 26 October, a classic sign of supply unlocking in weak phases. Those dates lined up with pullbacks and a reset in bullish appetite. The message is not subtle. When long-idle coins wake up, rallies tend to stall unless demand overwhelms the fresh flow.
Range math, not wishful thinking
After breaking below an eight-month range in October, SHIB settled into a short-term zone between $0.0000093 and $0.0000113. The mid-level near $0.0000103 has acted like a ceiling, rejecting multiple attempts to push higher and sending price back toward the floor. Traders who treat the band like a boxing ring have fared better than those chasing breakouts that never confirmed.
The supply held by SHIB whales continues to trend lower, which matters more than talk. Lower whale share during bounces often signals distribution into strength. That dynamic has kept the recovery fragile and left bulls negotiating for inches rather than yards. Until that curve flattens or turns higher, sustained upside will need a catalyst that refills demand.
Signals that count right now
On the four-hour chart, MACD leans bearish, a clean reflection of fading strength. At the same time, On-Balance Volume has carved higher lows for roughly three weeks, a small but important positive that hints at quiet accumulation. For traders shadowing SHIB whales, the mix is tricky. Momentum says respect the range. Volume says leave room for a squeeze if sellers blink.
Whale Data Requires More Than a Headcount
Large-holder activity can offer an early view of changing market pressure, but whale metrics need context because not every major address represents a single investor. Some of the largest SHIB wallets belong to exchanges, custodians, liquidity providers, staking contracts, or burn addresses, meaning a balance change may reflect customer deposits, internal transfers, or operational movements rather than direct buying or selling. The stronger signal appears when several indicators move together.
Falling whale-held supply, rising dormant circulation, weak price rebounds, and transfers toward exchanges would collectively support a distribution argument. By contrast, declining exchange balances, stronger On-Balance Volume, and a stable large-holder share would suggest that available selling pressure is beginning to ease. Traders should therefore avoid treating one wallet transfer as proof of a market-wide trend and instead compare holder concentration with price, volume, exchange flows, and token age data.
How to Read SHIB’s Main Market Signals
| Indicator | Current reading described | What it may suggest | Confirmation traders need |
|---|---|---|---|
| Large-holder supply | Trending lower since early September | Whales may be reducing exposure or distributing during rebounds | Continued decline alongside exchange inflows and weak price action |
| Dormant circulation | Spiked on October 19 and October 26 | Older SHIB holdings returned to circulation, increasing potential supply | Price weakness after the spikes and higher deposits to exchanges |
| MACD | Bearish on the four-hour chart | Short-term momentum remains weak | MACD crossing above its signal line with price reclaiming resistance |
| On-Balance Volume | Forming higher lows | Buying pressure may be improving beneath the range | OBV breaking higher while SHIB moves above $0.0000103 |
| Seven-day burn rate | Up roughly 139% | More tokens were removed from circulation than during the previous week | Sustained burns combined with stronger demand and lower whale selling |
| Range support | Near $0.0000093 | Buyers have defended the lower boundary so far | Repeated closes above support with improving volume |
| Range midpoint | Near $0.0000103 | Immediate resistance and a test of buyer strength | A decisive close above the level followed by a successful retest |
| Range resistance | Near $0.0000113 | Main short-term breakout barrier | Higher trading volume and price acceptance above the range |
No single indicator confirms a reversal. The more credible bullish case would require SHIB to reclaim the range midpoint while OBV strengthens, dormant circulation cools, and large-holder supply stops falling. Until those signals align, rallies may remain vulnerable to renewed selling.
Levels, scenarios, and what flips the script
If the lower edge near $0.0000093 gives way on convincing volume, bears will try to press into fresh lows. If price holds the floor and reclaims $0.0000103, attention shifts to the band top and the liquidity sitting just above it. Price acceptance over the range would tell readers that supply has thinned and late sellers are getting absorbed. In that case, even SHIB whales who have been net sellers could pause, which often softens volatility and allows the trend to reset.
Risk management still rules as SHIB whales often sell into strength during uncertain times, and that has punished late buyers. Position sizes, invalidation levels, and patience matter more than headlines. When the data flips, it will likely show up first in the supply-held curve stabilizing, dormant circulation cooling, and OBV breaking higher with price. Those are the breadcrumbs worth following.
Conclusion
The path forward is clear, even if it is narrow. The tape remains range-bound, momentum is soft, and on-chain distribution from large holders keeps a lid on rallies. A clean reclaim of $0.0000103 would be a start, but the lasting shift comes when supply trends stabilize and volume confirms it. Until then, the market trades the range it has, not the breakout it wants. The near-term bias stays cautious while SHIB whales appear to lean defensive.
FAQs
Is the recent selling from large holders new information?
Yes. On-chain metrics show the supply share of large holders has been falling since early September, with notable distribution after 10 October.
Do burns offset selling pressure?
Burns help reduce circulating supply, but they rarely overwhelm sustained distribution without rising demand. The seven-day burn rate recently rose about 139 percent.
Which indicators best capture trend quality here?
MACD for momentum, OBV for flow confirmation, and dormant circulation for supply shifts are the most helpful reads right now.
Glossary of Key Terms
Dormant circulation
A measure of older coins moving after long inactivity. Rising dormant circulation often signals supply entering the market from long-term holders.
On-Balance Volume (OBV)
A cumulative volume indicator that adds volume on up days and subtracts it on down days to gauge whether money is flowing into or out of an asset.
Moving Average Convergence Divergence (MACD)
A momentum tool that compares short- and long-term moving averages and uses a signal line to identify potential shifts in trend strength.
Range trading
A market condition where price oscillates between defined support and resistance. Traders focus on buying near support and selling near resistance until a breakout confirms.
Supply held by large holders
An on-chain metric tracking the percentage of total tokens controlled by the biggest addresses, often used to gauge distribution or accumulation pressure.