




Last Updated: July 17, 2026
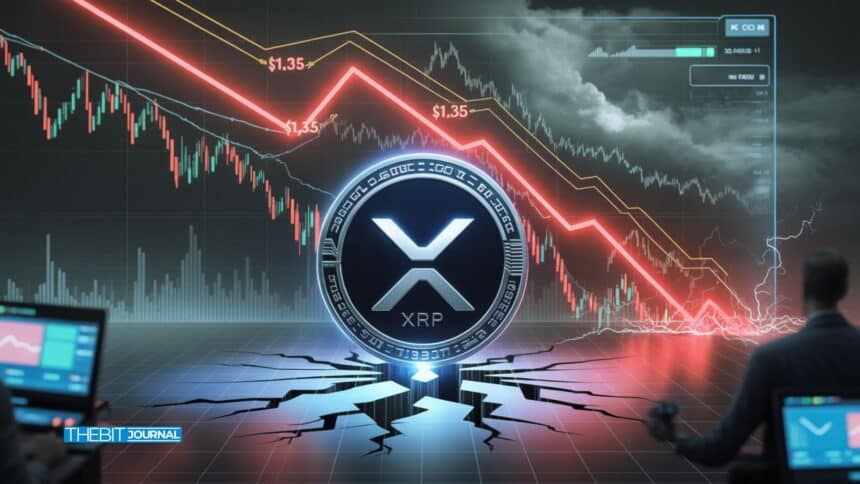
XRP price prediction is back in focus as the market faces a tense moment after another failed breakout near $1.35. Price action remains under pressure after another failed breakout near $1.35, leaving traders focused on whether XRP can defend a key support level. Traders now watch closely as XRP stands just above a key support level that may decide its next move.
According to the source, XRP traded at $1.3184 on April 7 after another rejection at resistance. The move marked the third failed breakout attempt since late March and kept traders focused on whether key support levels could hold.
Recent market activity shows XRP remains under pressure despite continued institutional interest in the asset. Traders are also monitoring ETF flows, derivatives positioning, and Bitcoin’s price movement, all of which could influence XRP’s next move.
Why Is XRP Price Prediction Turning Bearish After $1.35 Rejection?
The current XRP price prediction leans bearish as XRP continues to respect a descending trendline. Each rejection at $1.35 has come with increasing selling pressure, showing that buyers are losing grip.
Market observers often note that repeated rejections signal a stronger trend. As one analysis explains, “consistent failure at resistance reflects market exhaustion on the upside”. This behavior strengthens the case for continued downside risk.
The Supertrend indicator, now at $1.3247, adds another layer of resistance. Together, these signals reinforce the current XRP support and resistance levels, keeping price pinned under pressure.

Can XRP Price Prediction Hold Above $1.30 Support?
The biggest question in the current XRP price prediction is whether the $1.30 level can hold. This zone acts as immediate support and has prevented deeper losses so far.
Momentum indicators suggest caution. The MACD remains in negative territory, while the histogram shows only a weak recovery attempt. At the same time, the RSI sits at 38, which signals weak strength without reaching oversold conditions.
These indicators show that XRP still has room to drop. The XRP support and resistance levels highlight $1.30 as a fragile floor. A break below it could quickly shift sentiment and accelerate selling pressure.
What Do XRP Support and Resistance Levels Reveal Next?
The XRP support and resistance levels outline a narrow but critical trading range. The area between $1.30 and $1.28 acts as a decision zone where the market may choose direction.
If price falls below $1.30, the next level to watch is $1.28. This level aligns with a key Fibonacci retracement and has held since February. However, if that level breaks, support becomes thin, opening a path toward $1.15.
On the upside, XRP must reclaim $1.35 to shift the XRP price prediction toward a bullish outlook. A further move above $1.38 would strengthen confidence. Until then, the XRP support and resistance levels remain tilted in favor of sellers.
Are Market Signals Confirming a Bigger XRP Price Prediction Drop?
The broader XRP price prediction becomes more concerning when looking at derivatives data. Futures open interest is rising while price declines, which may indicate growing bearish positioning. However, open interest alone does not confirm whether traders are opening predominantly long or short positions.
ETF flows also add pressure. XRP ETFs recorded $3.56 million in outflows during the past week. This may reflect weaker institutional participation during the period, although short-term ETF flows do not always indicate a longer-term change in investor sentiment.
Liquidity conditions make matters worse. Thin order books mean price can move sharply when key levels break. The XRP support and resistance levels therefore carry more weight than usual in shaping market direction.

What Should Traders Watch Next?
Beyond the technical indicators, traders should keep an eye on overall crypto market sentiment, Bitcoin’s price direction, ETF fund flows, and derivatives activity. These factors often influence XRP’s short-term price movements alongside key support and resistance levels. A sustained move above $1.35 could improve market sentiment, while a break below $1.30 may increase selling pressure toward lower support zones.
XRP Market Snapshot
| Metric | Status |
|---|---|
| Trend | Short-term Bearish |
| Immediate Support | $1.30 |
| Next Support | $1.28 |
| Resistance | $1.35 |
| Major Resistance | $1.38 |
| RSI | 38 (Weak Momentum) |
| MACD | Bearish |
Conclusion: Will XRP Price Prediction Break or Bounce Next?
While the short-term outlook remains cautious, XRP has not yet confirmed a larger breakdown. Holding above $1.30 could allow the token to stabilize, whereas losing this support may expose the next downside levels around $1.28 and $1.15. Traders should combine technical indicators with broader market developments before making investment decisions, as sentiment can change quickly in the cryptocurrency market.
This article is for informational purposes only and does not constitute financial advice. Readers should conduct their own research before making investment decisions.
Glossary of Key Terms
Support Level: A price where buying demand may prevent further decline.
Resistance Level: A price where selling pressure limits upward movement.
MACD: An indicator that tracks momentum and trend direction.
RSI: A measure that shows whether an asset is overbought or oversold.
Fibonacci Retracement: A tool used to identify possible support and resistance zones.
FAQs About XRP Price Prediction
What is the current XRP price prediction?
The XRP price prediction suggests downside risk if price breaks below $1.30 support.
Why is $1.30 important for XRP?
It acts as a key support level. Losing it may push price toward $1.28 or lower.
What are XRP support and resistance levels now?
Support lies between $1.30 and $1.28, while resistance sits near $1.35 and $1.38.
Can XRP still recover?
Yes, but it must break above $1.35 and hold momentum above resistance levels.
Sources/References