







This article was first published on The Bit Journal.
The latest Bitcoin price prediction has become more complex. Despite having recovered from recent lows and even climbing back over $63,000, there are still plenty of warning signs that suggest the market may not be out of danger yet.
While spot Bitcoin ETFs are starting to see money flow back in after weeks of non-stop withdrawals, institutional demand in the United States is looking weak and several profit-based indicators are now similar to those seen just before previous bear market bottoms started to form.
The result is a market caught in a tug-of-war between hopes for a recovery and the fear of another downturn.
Coinbase Premium Sends a Rare Warning Sign
According to CoinGlass data, the index has now remained negative for 50 consecutive days, the longest streak ever recorded since the metric began tracking Bitcoin’s price difference between Coinbase and Binance. A negative reading means Bitcoin is trading cheaper on Coinbase, which typically reflects weaker buying demand from U.S. investors and institutions.
In past cycles, prolonged negative premiums have often coincided with periods of institutional caution rather than aggressive accumulation.
For traders who follow Bitcoin price prediction, this matters because US institutional money has become one of the biggest drivers of Bitcoin price movements since spot ETFs came on the scene in early 2024.
The lack of strong US demand may not be a guarantee of lower prices, but it definitely removes one of Bitcoin’s strongest support pillars.
NUPL Crossover Raises Bear Market Questions
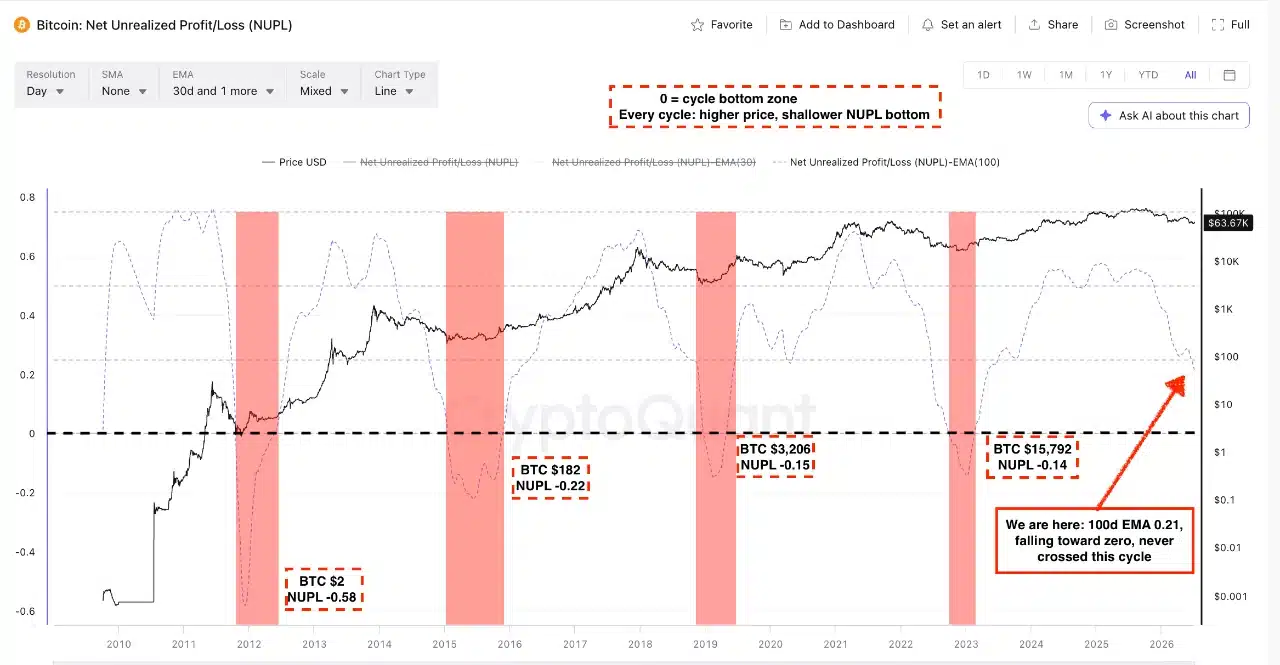
Another closely watched signal is Bitcoin’s Net Unrealized Profit and Loss ( NUPL). Recent market data has shown Bitcoin’s 30-day exponential moving average of NUPL crossing below the 100-day average on June 2. The shorter average was at 0.155 while the longer-term reading was at 0.215. Both values remain above zero, meaning the average Bitcoin holder is still sitting on unrealized gains rather than losses.
However, the crossover itself points to diminishing profitability and weakening momentum among holders.
Previous major bear market bottoms in 2011, 2015, 2018 and 2022 all shared one thing in common- the 100-day NUPL average eventually dropped below zero, signifying that investors had given up and started selling their coins at a loss.
That hasn’t happened yet this time around. So that leaves analysts with two possibilities: either Bitcoin forms its very first major cyclical bottom without widespread capitulation, or there is need for another downturn before that becomes possible.
For the current Bitcoin price prediction, the zero line on the 100-day NUPL indicator will likely become one of the most important levels to monitor in the second half of July.
ETF Inflows Offer Bulls a Reason for Optimism
Not every signal is bearish news. After 8 weeks of non-stop outflows, US spot Bitcoin ETFs have started attracting buyers again. On July 2, these ETFs recorded net inflows of $221.7 million, putting an end to a painful 10-day withdrawal streak that had erased over $2.73 billion from the sector. And just this week, things have picked up even more.
Fresh data dropped on July 7 showed Bitcoin ETFs taking in a further $265.69 million in net inflows, the biggest daily intake in over a month. BlackRock’s IBIT fund was responsible for around $209.4 million of that total, while ARKB and Grayscales mini BTC fund also brought in some welcome positive flows.
Still, the bigger picture is looking tough at the moment.
Bitcoin ETFs still lost about $526.6 million during the shortened trading week, and that is 7 weeks in a row that they’ve been seeing outflows. That is the longest weekly outflow streak since the products first came out.
For Bitcoin price prediction calling Bitcoin to $80,000, there will be a need for more sustained inflows into the ETFs.
Could Bitcoin Still Plummet Towards $50,000?
Some analysts are concerned that Bitcoin may still need to see more losses before it can really bottom out.
One area receiving attention sits between $48,000 and $50,000, where large clusters of stop-loss orders and leveraged liquidations are believed to exist
Market makers tend to target these kinds of liquidity pools when things get uncertain, which can cause temporary selloffs before a reversal happens.
Benjamin Cowen, a former NASA engineer and market analyst, has been pointing out that even though long-term Bitcoin holders have been hit with 3 quarters of losses in a row, they still seem to be holding on, which to him means that deeper capitulation has not yet occurred.
At the same time, Bitcoin’s technical indicators remain mixed.
The MACD is still printing out some bullish momentum, but the Relative Strength Index is showing the first signs of weakening. The Bollinger Bands are also tightening up, which is a sign that volatility is getting compressed. This often happens right before a big directional move.
Conclusion
The current Bitcoin price prediction is torn between different outcomes.
Institutional demand is coming in softer than a lot of people expected, as shown by that record negative Coinbase Premium streak and weakening profitability metrics.
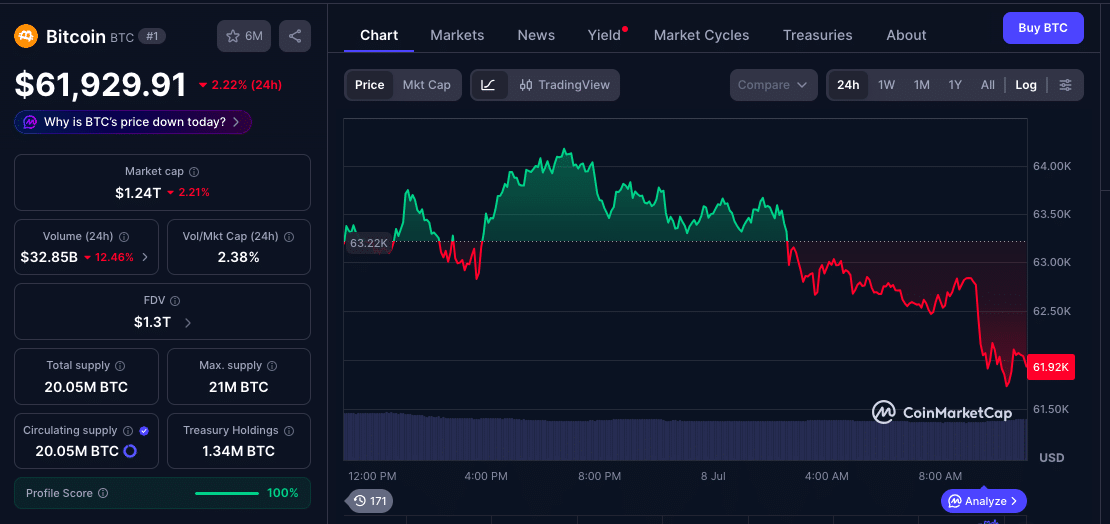
But even so, ETF inflows are starting to pick up again, and Bitcoin has managed to bounce back 7% over the past week, while still holding above $63,000.
If institutional buying picks up again and the ETF demand keeps on improving, then the path to $80,000 could be more realistic.
If those inflows fade away again, then the market may still need to revisit some of those lower liquidity zones before the next big rally comes along.
Glossary
Bitcoin Premium Index: An indicator that is a measure of how much more expensive Bitcoin is on Coinbase compared to Binance.
NUPL: Net Unrealized Profit and Loss – an on-chain metric that measures investor profitability.
ETF: A type of exchange-traded fund that gives people regulated exposure to Bitcoin.
MACD: a momentum indicator that helps spot trend strength and identify potential reversals.
Bollinger Bands: A technical analysis tool that is used to identify volatility and potential breakouts.
Frequently Asked Questions About Bitcoin Price Prediction
What is the Coinbase Bitcoin Premium Index?
It measures the price difference between Bitcoin on Coinbase and Binance and is commonly used to track U.S. institutional demand.
Why is the 50 day negative premium important?
It shows the longest period of weak US demand for Bitcoin ever recorded and may indicate institutional caution.
Are Bitcoin ETFs seeing inflows again?
Yes. Bitcoin ETFs brought in $221.7 million on July 2 and another $265.69 million on July 7 after weeks of investors pulling their money out.
Could Bitcoin fall to $50,000?
Some analysts think that the $48,000 to $50,000 range might be a a liquidity zone, before a long term bottom forms.
References