






Chainlink drew fresh attention after a large holder accumulated 1.58 million LINK, valued near $13.2 million, through several exchange withdrawals over one week. The purchase reduced the amount of LINK readily available for trading, yet price action remained restrained. Instead of breaking higher, the token held above a fragile support zone while momentum indicators cooled. The latest Chainlink price prediction therefore depends less on the purchase size and more on whether buyers can defend the market’s key short-term levels.
Whale Withdrawals Strengthen the Supply Outlook
Large withdrawals matter because tokens moved away from an exchange are less likely to be sold immediately. The whale’s wallet grew to nearly 1.58 million LINK, worth about $13.3 million. That supported accumulation, although it did not guarantee an instant rally.
Markets often react slowly when broader demand is uncertain, much like a heavy door that still needs several people pushing before it swings open.
The Chainlink price prediction remains cautiously constructive while LINK stays above $8.18. However, accumulation cannot replace rising volume, stronger spot demand, and a clean technical breakout.
Chainlink Price Prediction Faces a Crowded Long Trade
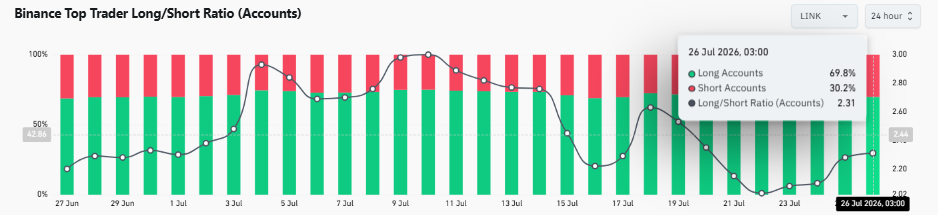
Leading derivatives traders showed strong bullish bias, with 69.8% holding long positions and 30.2% positioned short. That produced a long-to-short ratio of 2.31. A ratio above 1 means more traders expect price to rise, but heavy long exposure becomes risky when the market turns lower.
If LINK slips suddenly, leveraged longs may be forced to close, adding selling pressure. For that reason, the Chainlink price prediction must account for optimism and the risk of a liquidation-driven dip.
Price Analysis: Levels That Could Decide LINK’s Move
| Indicator or level | Reading | Market meaning |
|---|---|---|
| Whale accumulation | 1.58M LINK | Lower near-term exchange supply |
| Main support | $8.18 | Bulls must defend this floor |
| Liquidation cluster | $8.215 | Possible short-term price magnet |
| Parabolic SAR | Near $8.75 | Sellers hold short-term control |
| Long/short ratio | 2.31 | Bullish positioning looks crowded |
The MACD stayed above its signal line, which normally supports a bullish view. Still, its shrinking histogram showed buying momentum losing speed. The Parabolic SAR moved above price near $8.75, signalling that sellers had regained short-term control.
These readings make the Chainlink price prediction more balanced than the whale purchase suggests. The market has support, but it lacks convincing acceleration.
Why $8.215 Matters to Traders
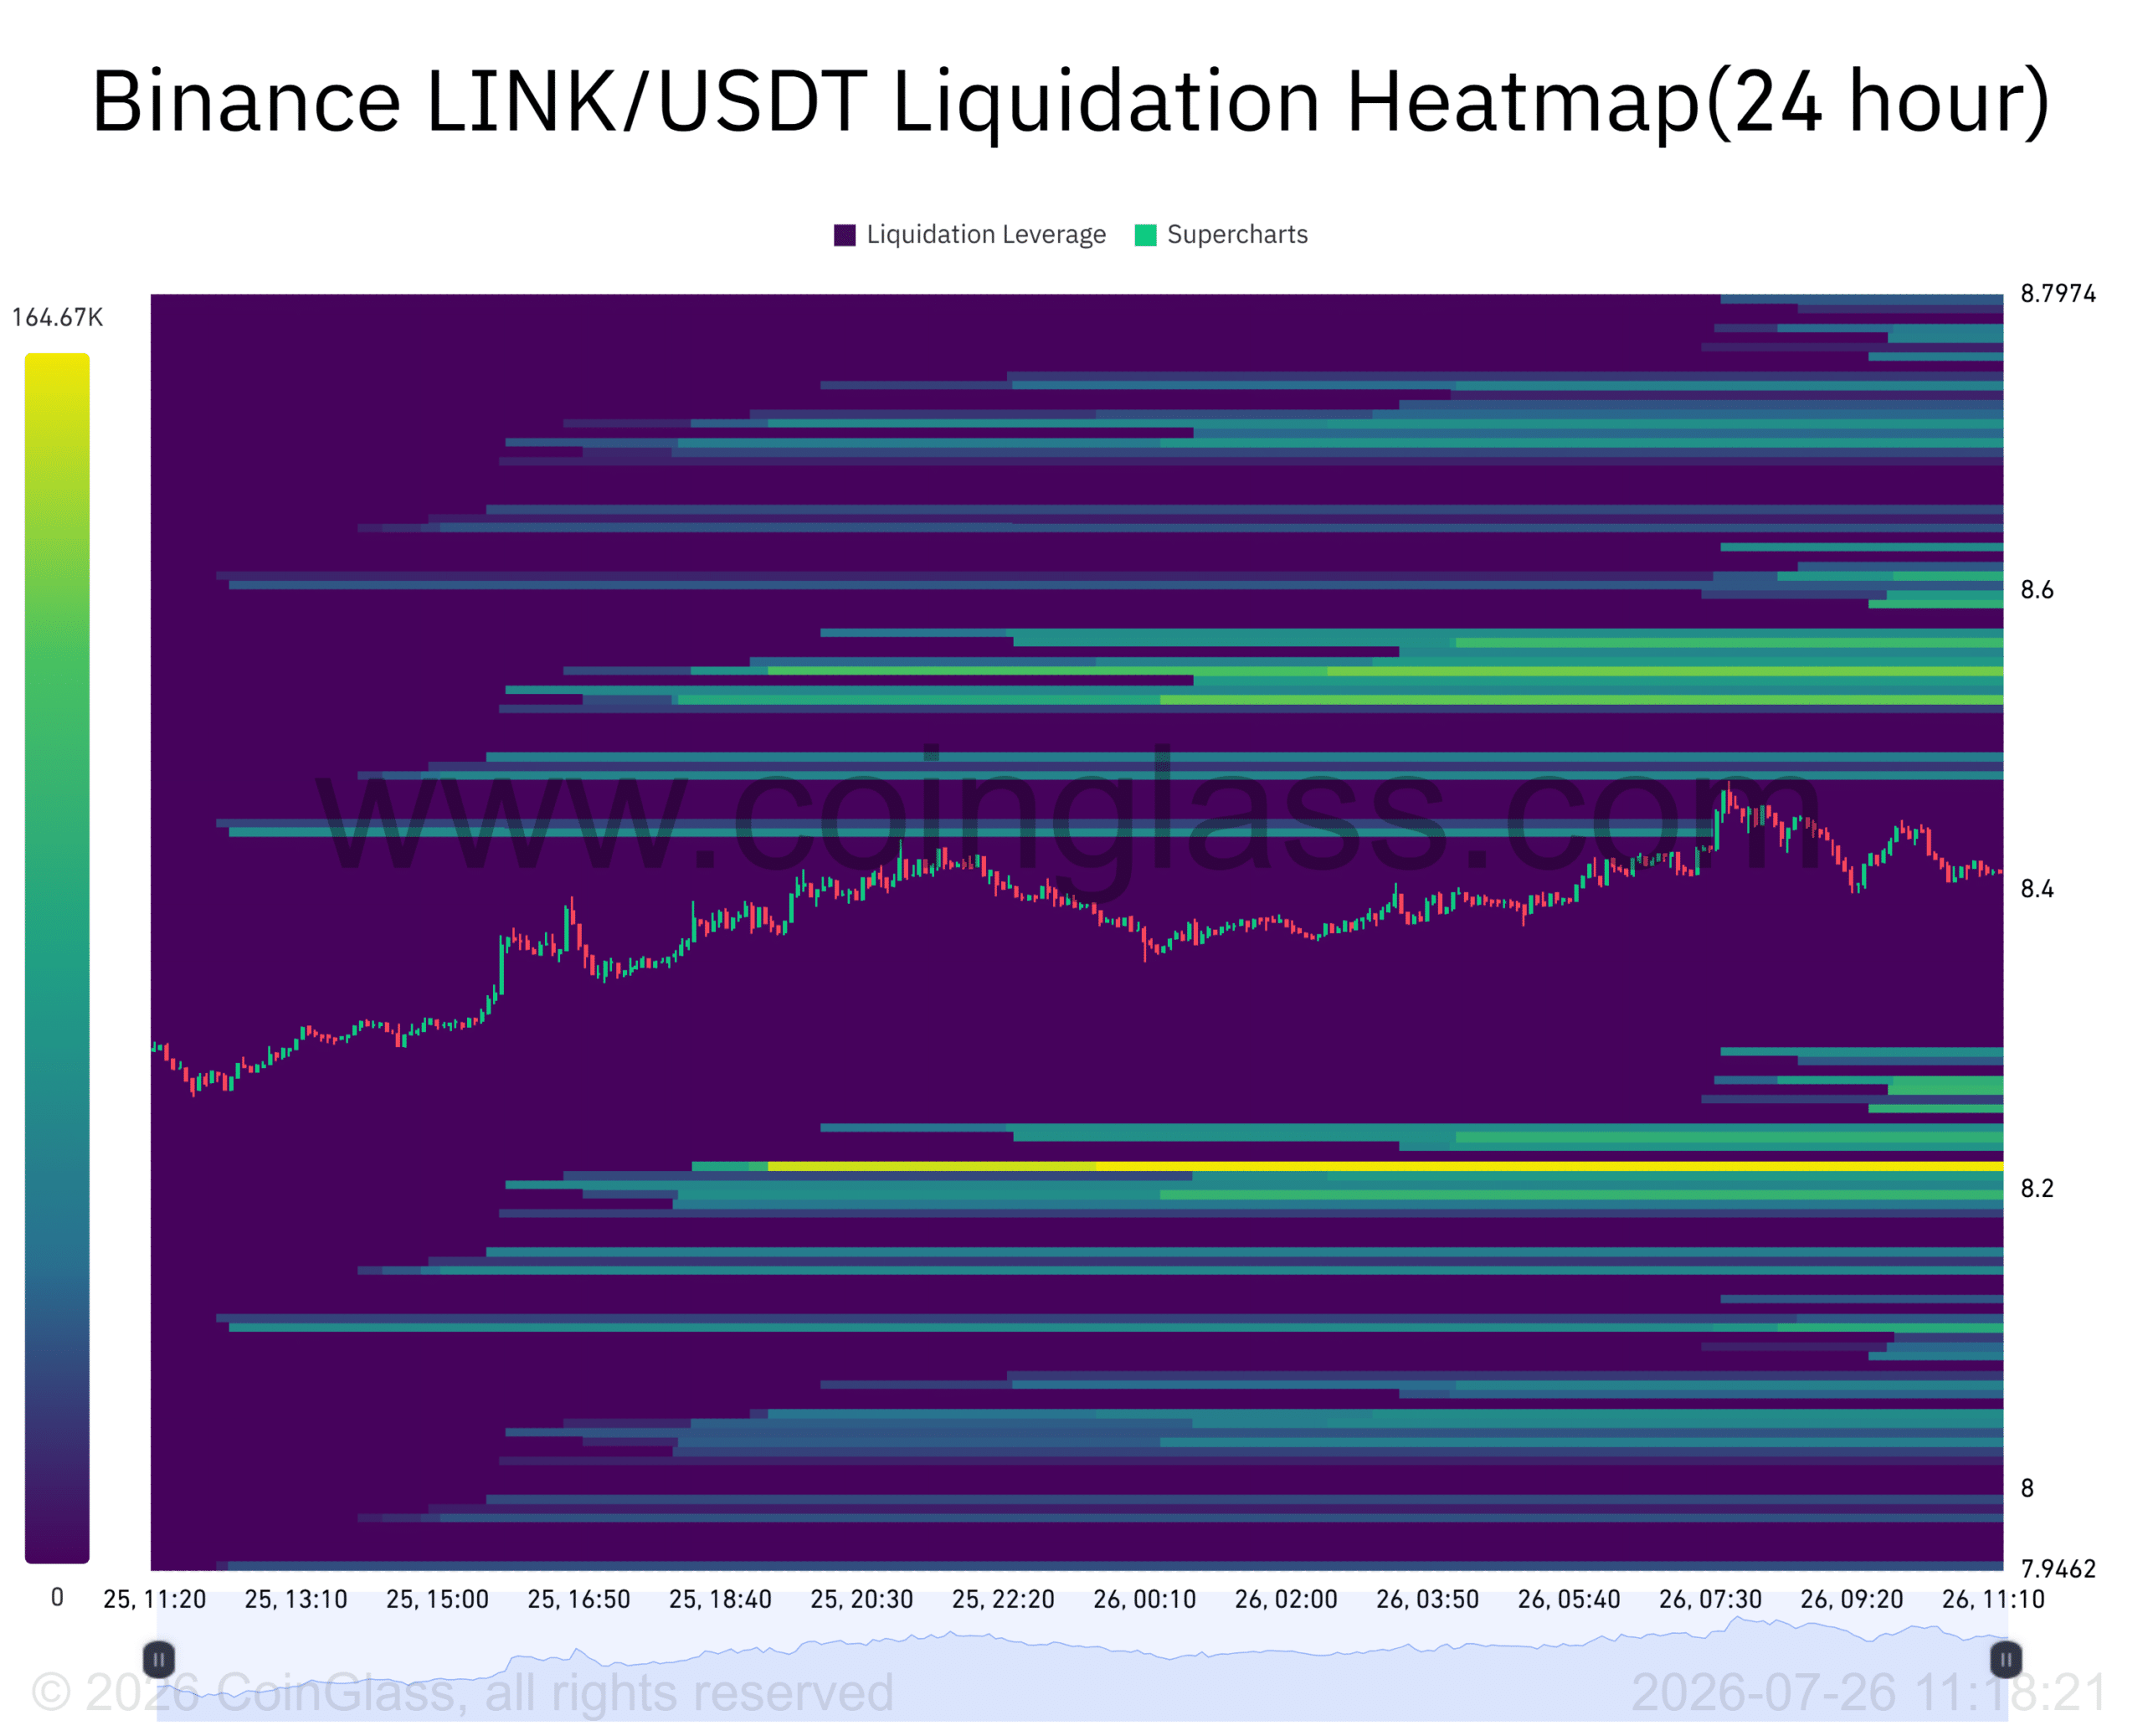
A liquidation heatmap placed the largest nearby leveraged cluster around $8.215, with roughly 164,670 in exposure. Prices often move toward dense liquidity zones because forced closures create available orders. This does not mean LINK must fall there, but it gives traders a clear level to watch.
A hold above that region could improve the Chainlink price prediction. A decisive loss may expose lower support before another recovery attempt. For now, the Chainlink price prediction remains tied to defence of this narrow zone.
Conclusion
The whale purchase improved LINK’s supply picture, but the market still needs confirmation. Bulls are defending $8.18, while weakening momentum and crowded longs leave room for volatility. The Chainlink price prediction strengthens only if buyers reclaim nearby resistance with rising volume. Until then, accumulation is encouraging, not conclusive.
Frequently Asked Questions
Why did the whale withdrawal matter?
It reduced exchange-held supply and suggested the buyer may intend to hold LINK.
Is LINK currently bullish?
The broader setup is cautiously bullish, but short-term indicators show fading momentum.
What price level matters most?
The $8.18 to $8.215 area is the main support and liquidity zone.
Can whale buying guarantee a rally?
No. Price still depends on demand, volume, and wider market conditions.
Glossary of Key Terms
Whale: A holder controlling a large amount of cryptocurrency.
MACD: A momentum indicator showing whether buying or selling strength is changing.
Parabolic SAR: A trend indicator signalling potential market direction.
Liquidation: The forced closure of a leveraged trade after losses grow too large.
Support: A price area where demand may slow a decline.
Disclaimer: This article is for informational purposes only and does not provide investment advice. Cryptocurrency prices are volatile, and readers should conduct independent research before making financial decisions.
Sources